


Uncharted 23

Dear subscribers,
After showing resilience last week, bitcoin caved in to external pressures. Ethereum extended its outperformance and drove altcoins, but the next bull run depends on a stable bitcoin. Swissblock's Bitcoin Risk Signal is at the high-risk extreme, yet we believe the bottom is in.
Let's dig in!
TL;DR
Bitcoin dropped to sub $20k levels for the first time since early July due to a systematic selloff spreading from traditional markets.
The sharp rise in US-Treasuries and drop in US equity markets indicated that investors moved to cash.
The market is pricing a 75bps rate hike in the September FOMC as the most likely outcome considering the tight labor market.
Bitcoin's correlation to the S&P 500 and Nasdaq remained strong, near the year-to-date average.
The spot market dominated futures in view of dampened sentiment and speculative demand for ethereum.
Bitcoin annualized rolling basis in contango hinted at a not so pessimistic expectations.
Historically, October and November are bitcoin's stellar months, so what can we expect for Q4'22?
A move to cash
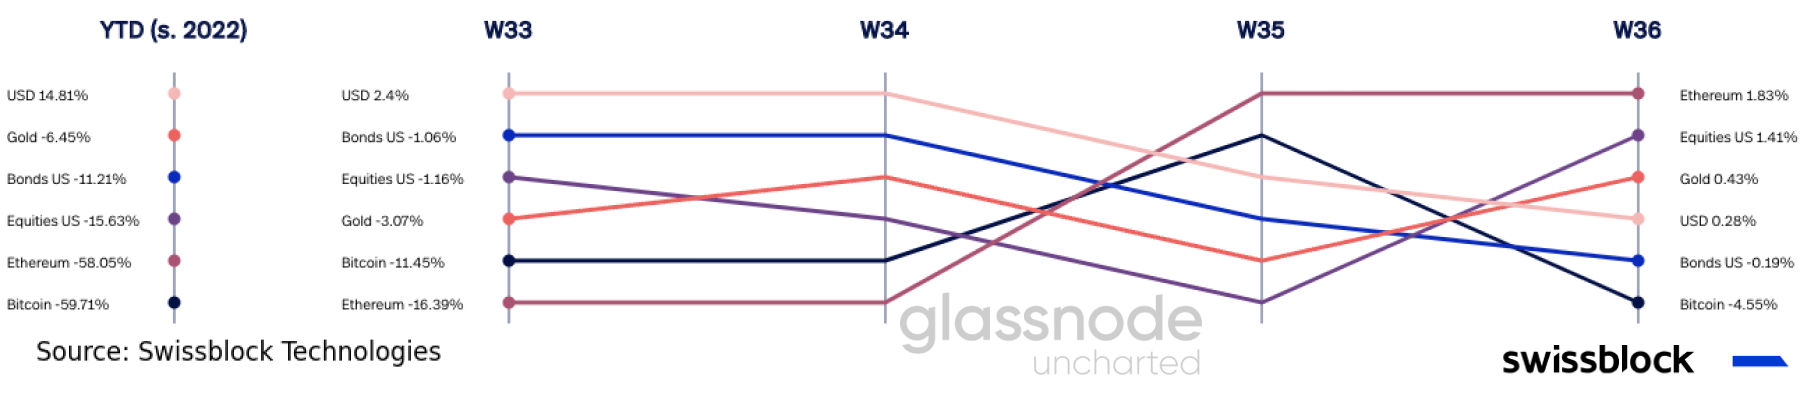
Since August 10th, markets have bled due to hawkish remarks from Fed key members, DXY pressures, and what appears to be a systematic capitulation across asset classes (Figure 1). Bitcoin was not spared; it underperformed after showing relative strength last week.
Figure 1: Weekly returns
The most likely outcome for the September FOMC meeting is a 75bps rate hike. The target rate probability for a hike of said magnitude is priced at a 86% probability – an ongoing trend we noted in our previous Uncharted.
Figure 2: 75bps rate hike priced in for the September FOMC meeting
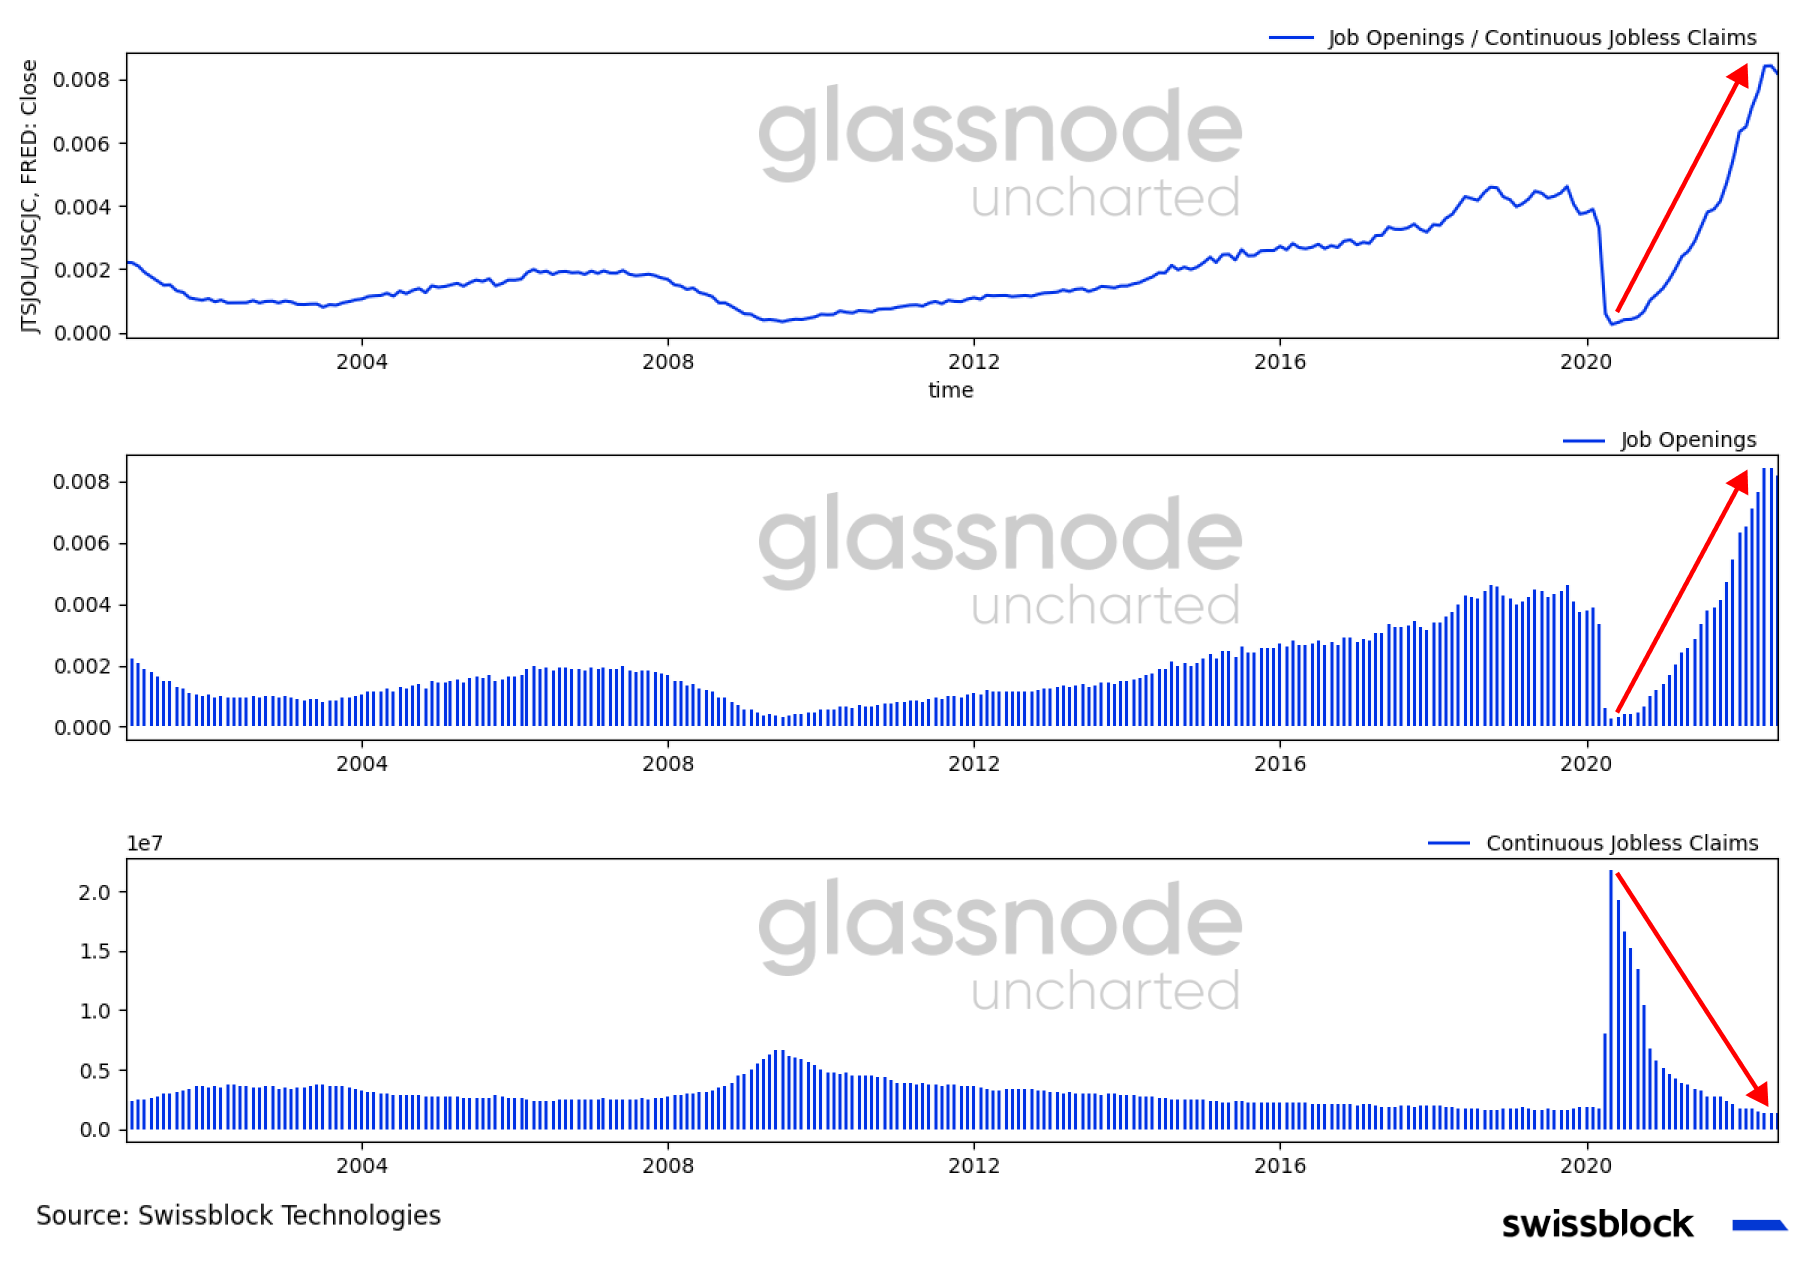
Despite the hit commodity prices took - Brent and WTI below $90 - the labor market warned of further inflationary pressures. Supply in the labor market surpassed expectations by nearly 1mn open positions, while initial jobless claims remained at low levels (Figure 3). This imbalance in the job market tends to push wages higher as employers go above and beyond to attract unfilled positions, strengthening demand.
Figure 3: Labor market pushing prices higher
To add to the Fed’s encouragement to pursue a 75bps rate hike, the ISM Manufacturing PMI came in at expansionary levels (52.8) in August. The subindices suggest that even though new orders and a backlog of orders grew at a slower pace, manufacturing prices remained in the expansionary region (Figure 4).
Figure 4: A growing manufacturing sector
Under normal circumstances, markets would flourish with an expansive manufacturing sector and low unemployment rate. However, the likelihood of a 75bps rate hike caused a significant selloff in the bond market. Notice how the US10Y rose to 3.267%, shy of the selloff witnessed after the surprising and expeditious rate hike in June (Figure 5).
Figure 5: Sell-side demand propelled the US10Y

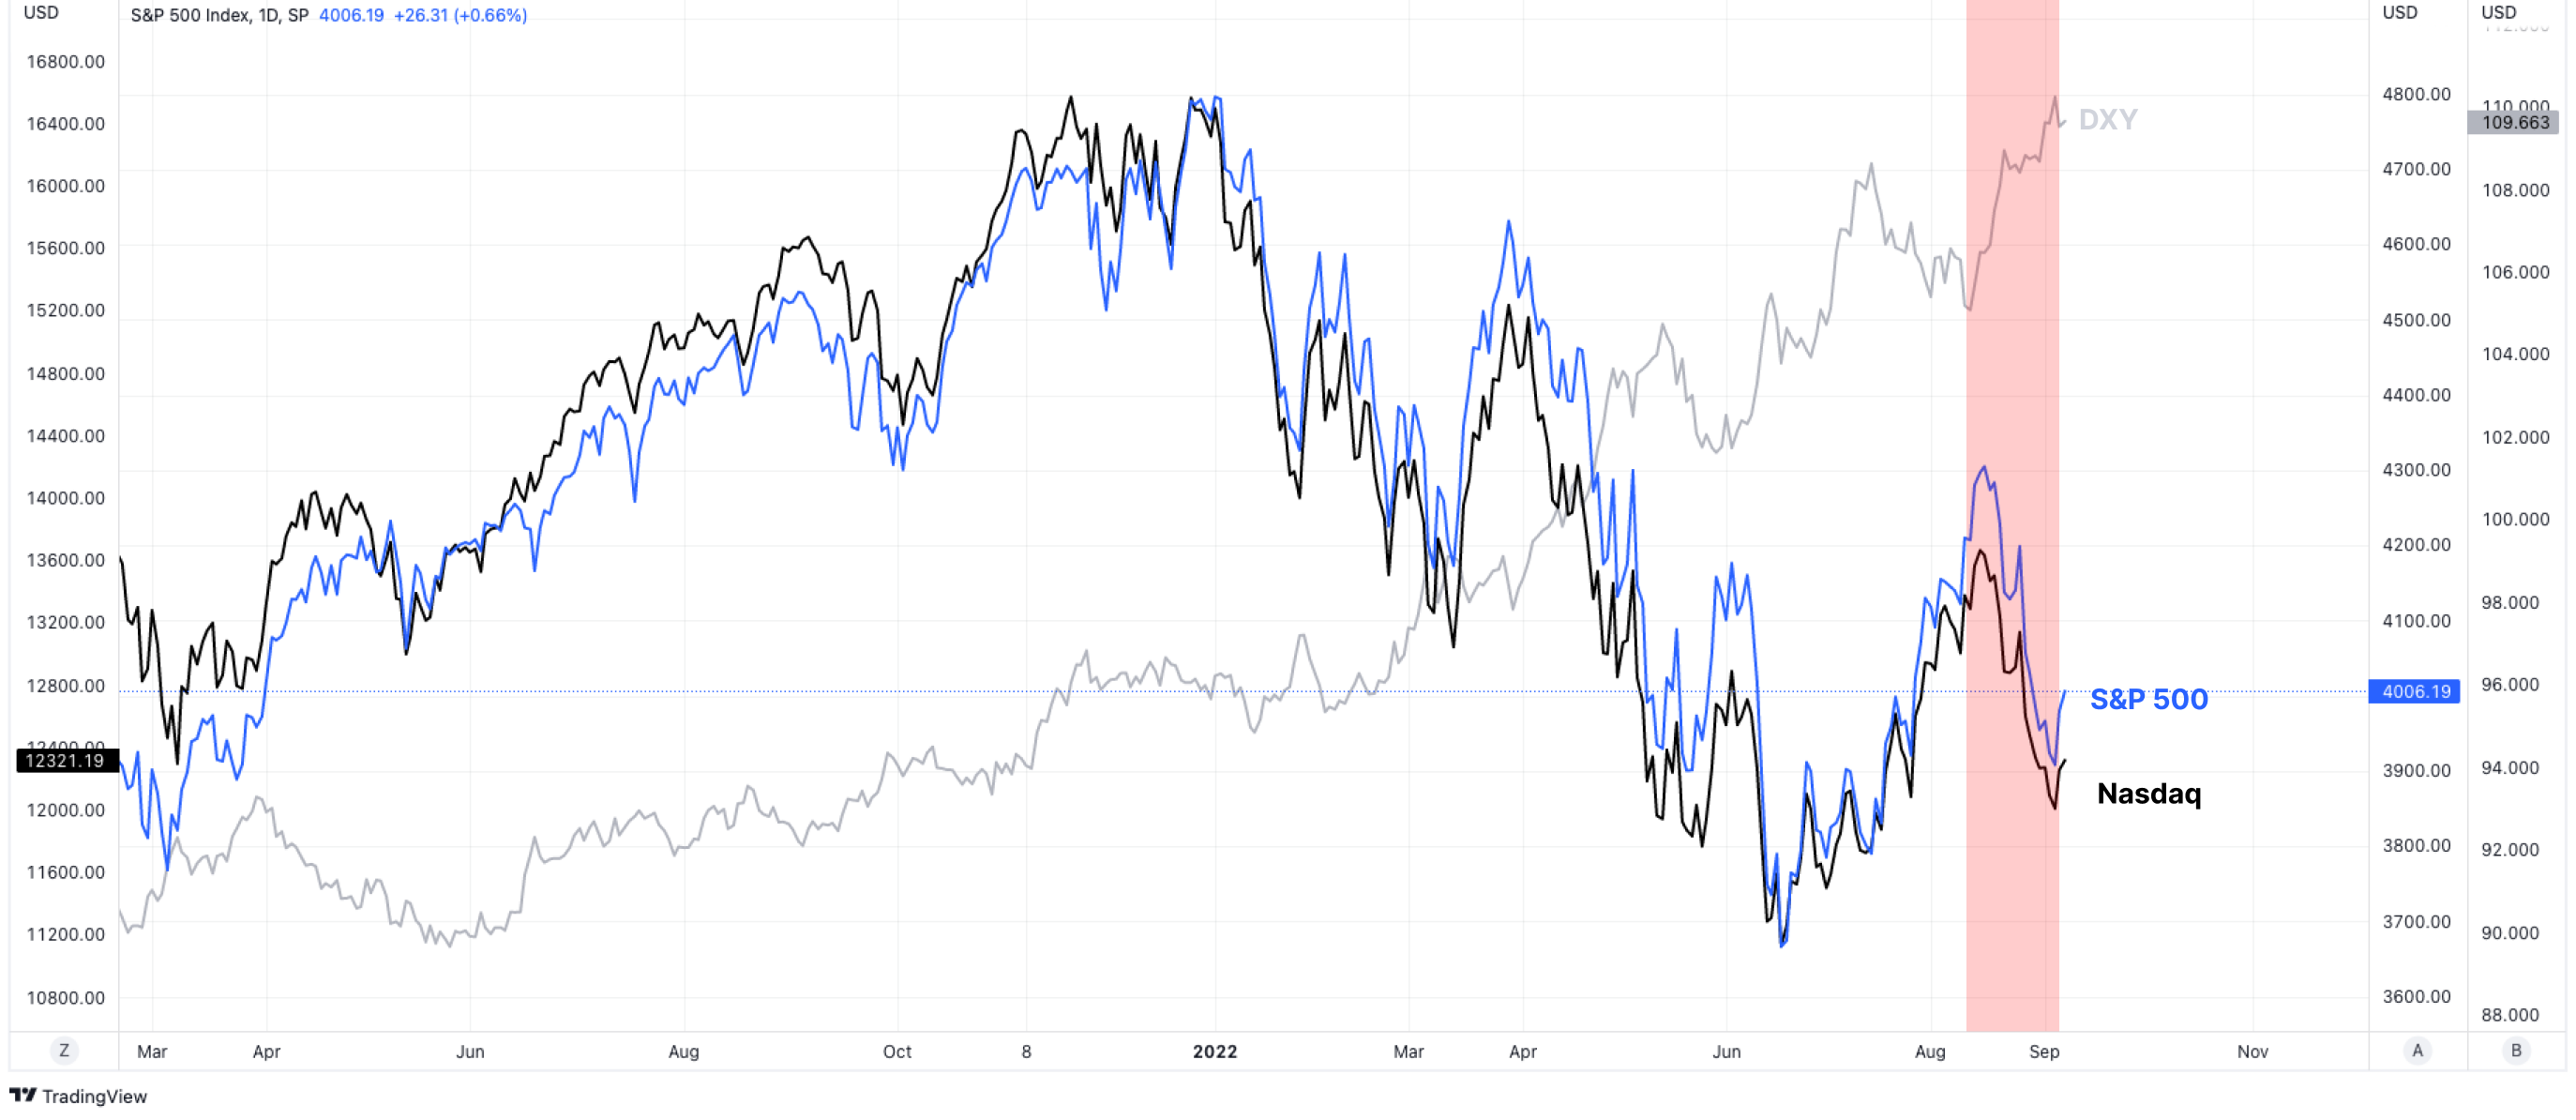
Looking at yields, you see that the selling of treasuries went into cash, not stocks (Figure 6). The DXY reverted and broke to 109, marking a new yearly and multidecade high, while the S&P 500 and Nasdaq plunged.
Figure 6: DXY at levels not seen since June 2002
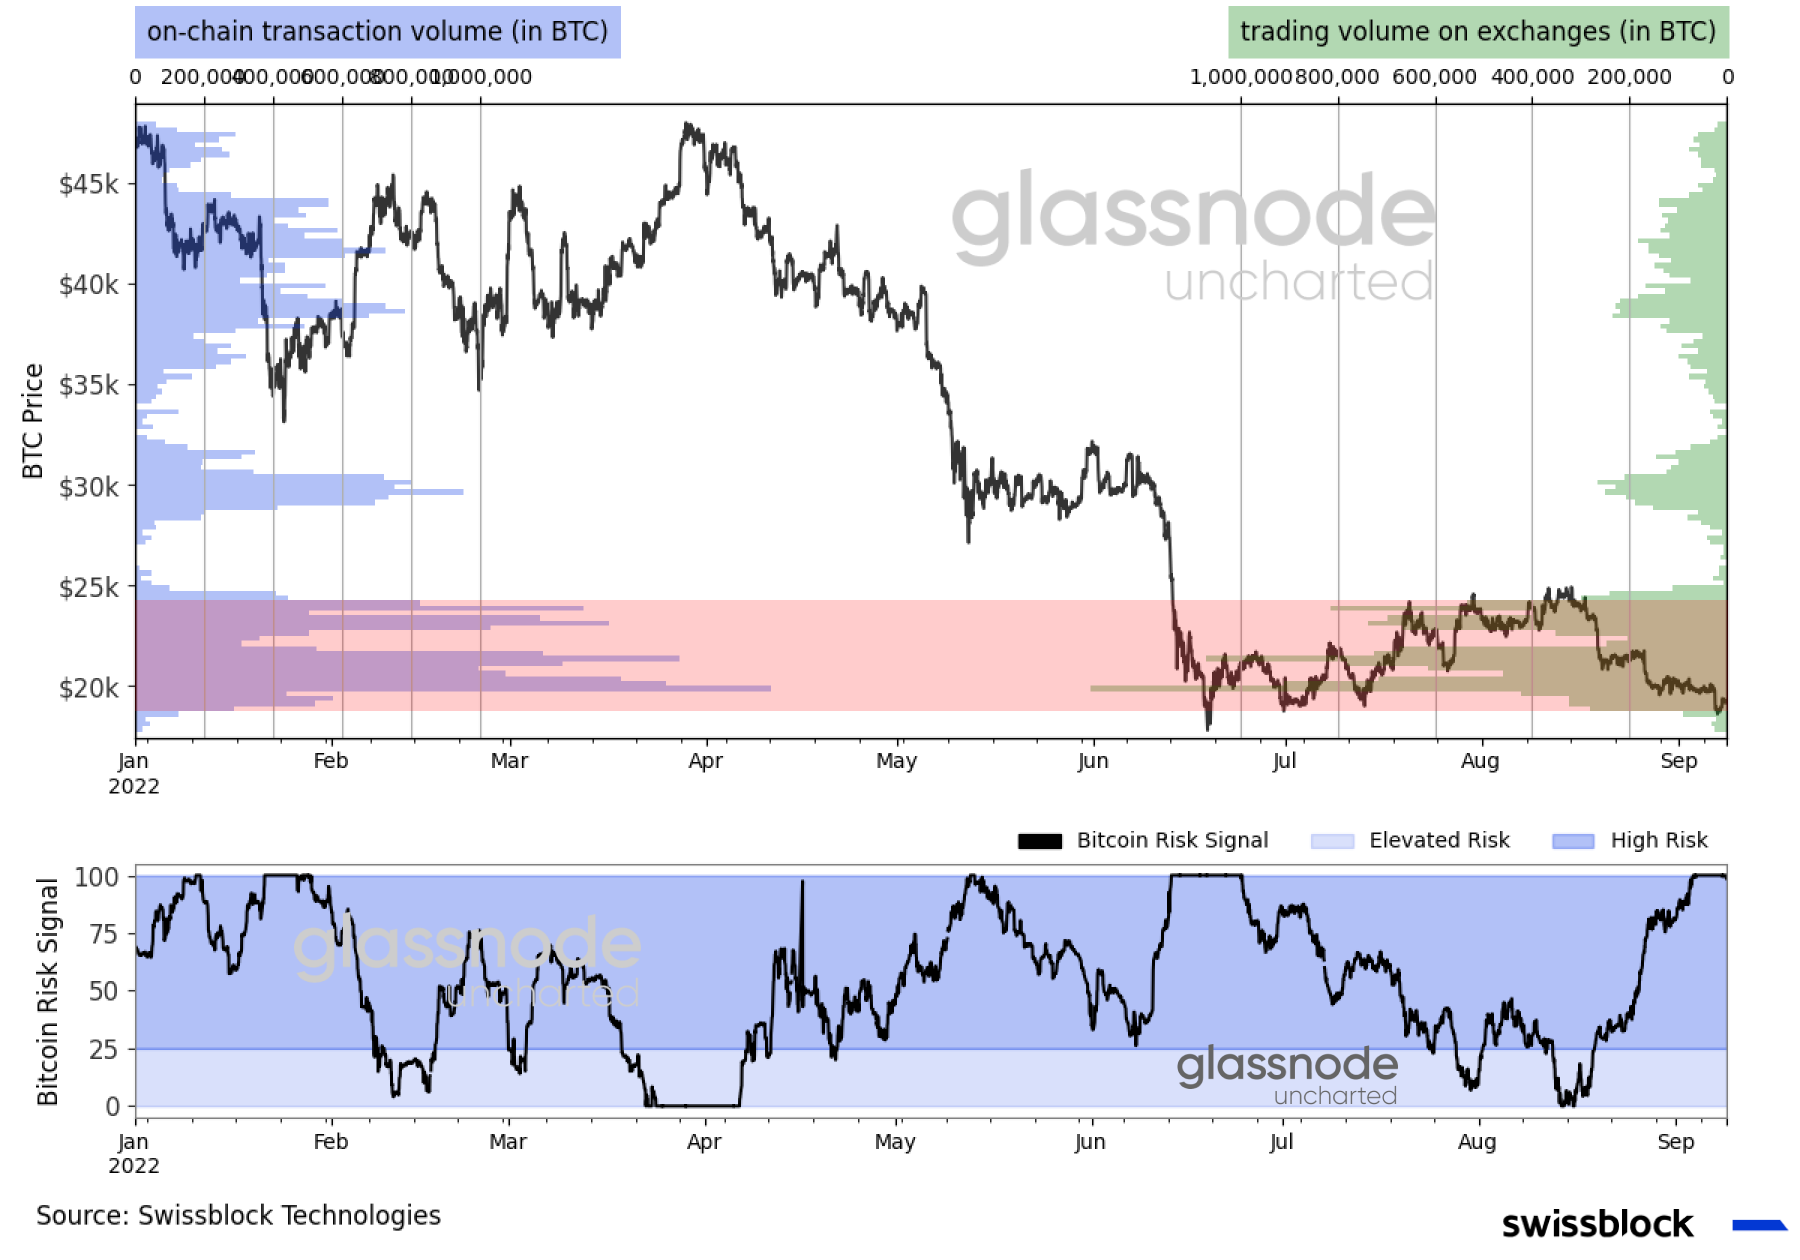
Capital did not flow to bitcoin either. The same day equity markets initiated their downward trend, bitcoin dove to the lower range of our ongoing trading channel ($17-$25k) as Swissblock’s Bitcoin Risk Signal skyrocketed to the high-risk extreme (Figure 7).
Figure 7: Bitcoin back at sub $20k levels
Furthermore, since then, bitcoin has logged four consecutive weeks of outflows in ETF and ETPs totaling $70mn, with $11mn last week (Figure 8). On the other hand, short-bitcoin instruments saw record inflows of $18mn as panic spread to crypto.
Figure 8: Bets placed against bitcoin

Bitcoin’s course
Even though sentiment dampened, and September is the worst performing month for bitcoin (-5.86% on average since 2013), the buying power for bitcoin is gradually building up. The stablecoin supply ratio oscillator (SSR) started trailing down as bitcoin shed market value (Figure 9).
Figure 9: Buying power for bitcoin
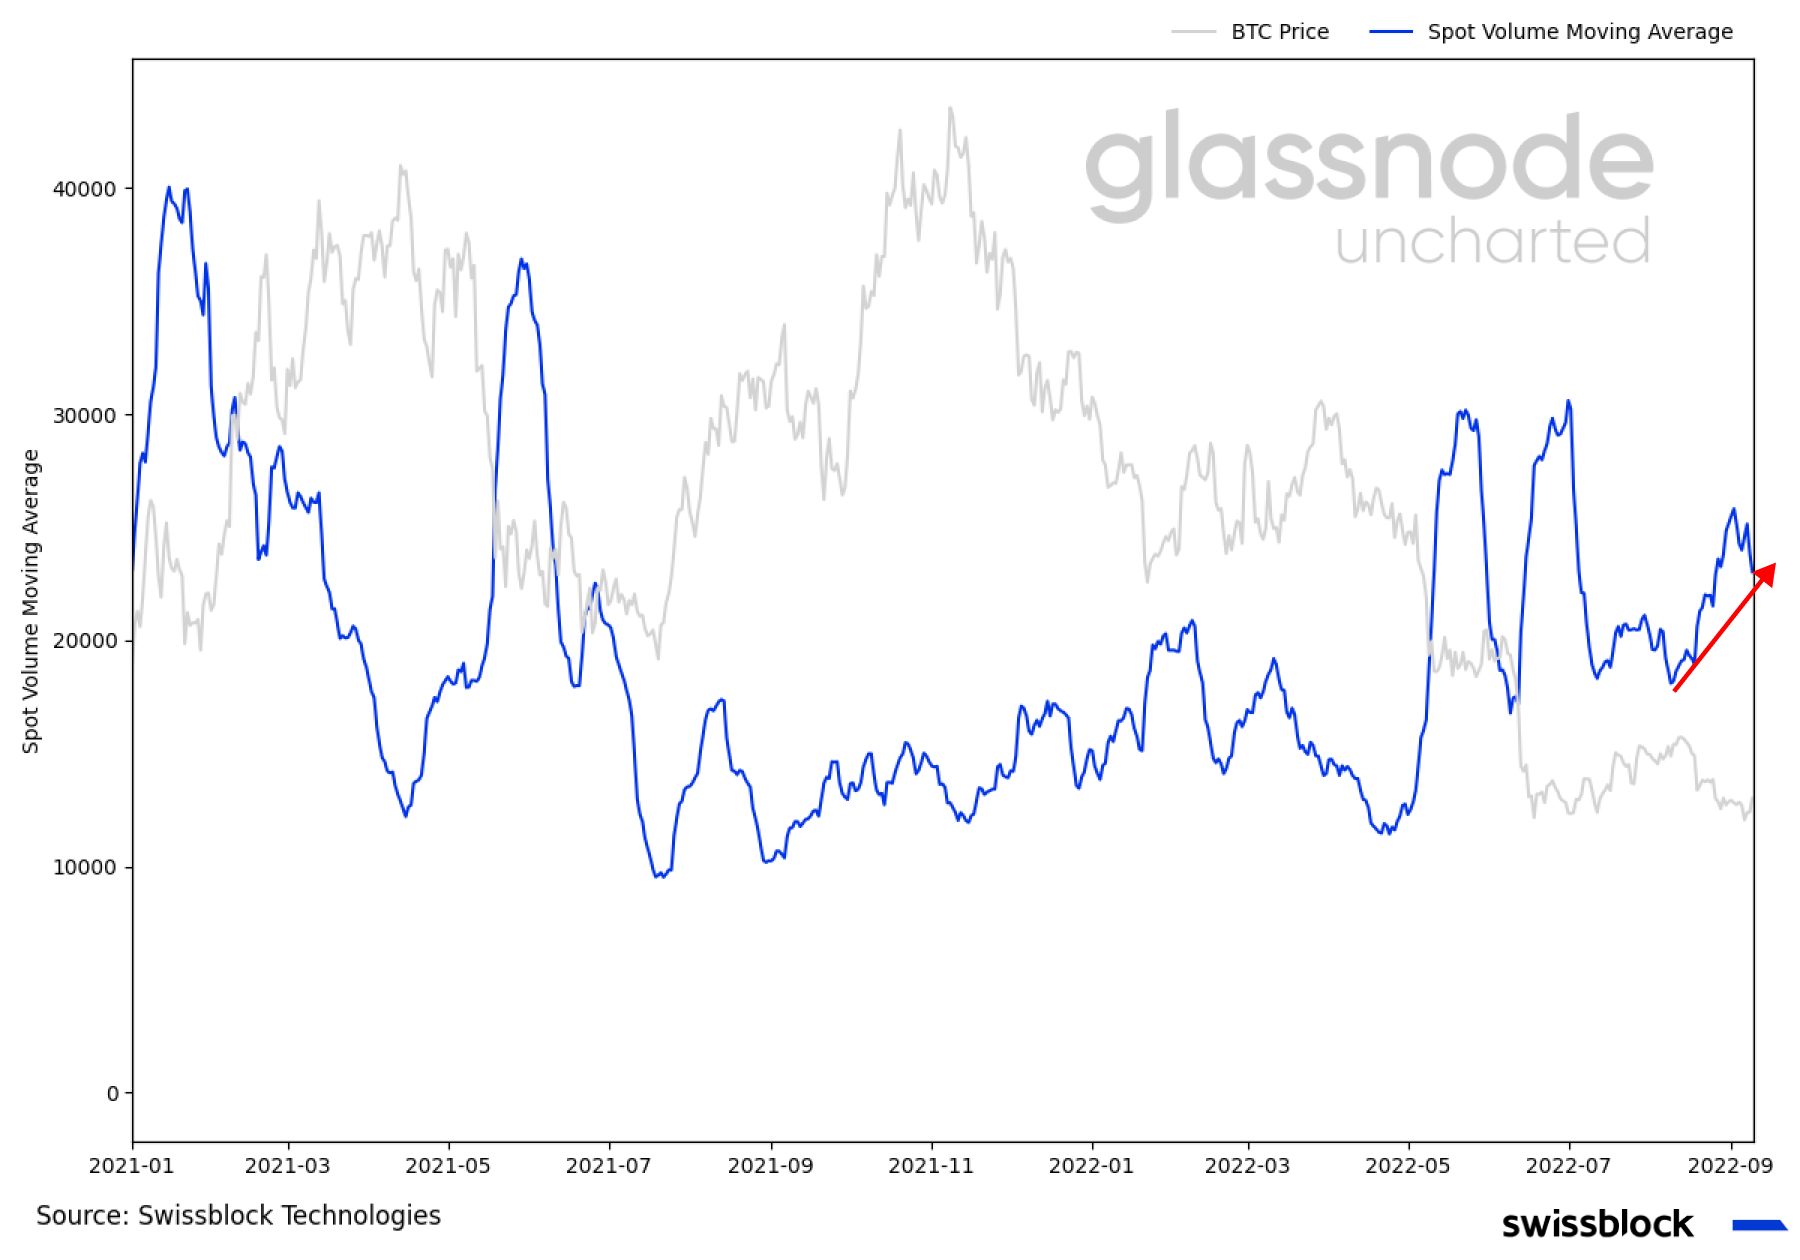
It is likely that bitcoin consolidates and avoids further declines if volume continues to pick up (Figure 10). Whenever liquidity is high, more coins are exchanged between buyers and sellers, implying that greater firepower is required to break above or below a significant price level.
Figure 10: Great firepower required to break highly liquid levels
Leverage in the system has also decreased since the beginning of August. The futures-to-spot volume ratio indicated that the demand for physical bitcoin exceeds that of the futures market (Figure 11), as the latter decreased by 19.7% month-over-month.
Figure 11: Spot market dominating
Greater spot volume has led to sustained runs in the past and reduces the exposure to liquidations if open interest is at relatively stable levels. Bitcoin futures open interest decreased by 8.7% month-over-month alongside the percent crypto-margined open interest (Figure 12).
Figure 12: Reduced risk of massive liquidations
Attention turned to ethereum as we verge upon the Merge date, which could have stirred interest away from bitcoin in recent weeks. Ethereum’s futures volume increased by 11.9%, exceeding bitcoin for the first time, logging nearly 1.11 times more transactions (Figure 13), and open interest increased by 12.3% month-over-month.
Keep reading with a 7-day free trial
Subscribe to Swissblock Insights to keep reading this post and get 7 days of free access to the full post archives.