


Uncharted 22

Dear subscribers,
Bitcoin saw an uptick in trend following a systematic selloff spreading over from traditional markets. The selling pressure spread within crypto leading to nearly 91% of the most prominent altcoins closing the week in the red and over $500 million in liquidations. Capital is gradually flowing into bitcoin as investors seek relative safety within the crypto space.
Let’s dig in!
TL;DR
Bitcoin held quite strongly amid a turbulent market bouncing back and forth between inflation and recession fears.
Investors split between a 50bps and a 75bps rate hike due to restored oil and hawkish remarks from Fed members.
Over $200 million in positions liquidated as bitcoin got rejected at the $25k resistance level.
Bitcoin outperformed altcoins as Swissblock’s Altcoin Cycle Signal lost steam.
Nearly 91% of the top 100 cryptos traded in the red in the past 7-days, however, ethereum extended its dominance.
Bitcoin showed strength as it decoupled further from US equities despite DXY pressures.
Bitcoin vs. an impotent Fed
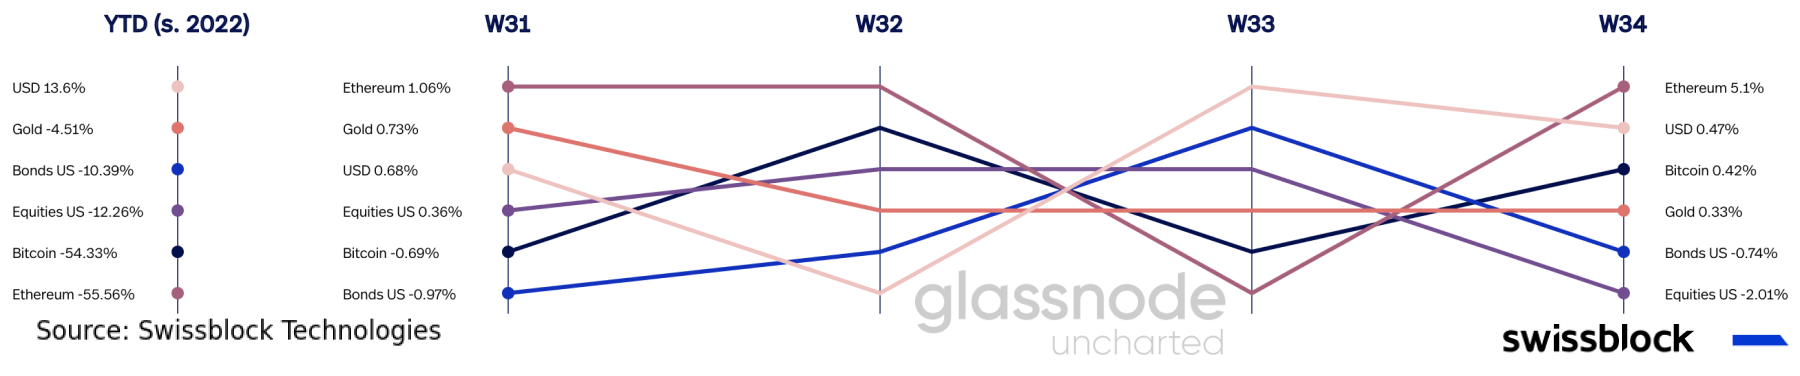
Speculation about Fed chairman Jerome Powell’s speech on Friday led to volatility and selling pressure across markets (Figure 1). Investors zigzagged between renewed fears of a third consecutive expeditious rate hike and a looming recession. However, bitcoin held quite strongly against US equities amid a turbulent market.
Figure 1: Crypto outperformed US equities
Since our previous Uncharted, the target rate probabilities for the September meeting have changed significantly. Investors are split between a 50bps and a 75bps rate hike as they weigh the recent disappointing key macro figures and the possibility of an even more hawkish stance (Neel Kashkari, president of the Federal Reserve Bank of Minneapolis).
Figure 2: Market expects a 75bps rate hike given hot inflation

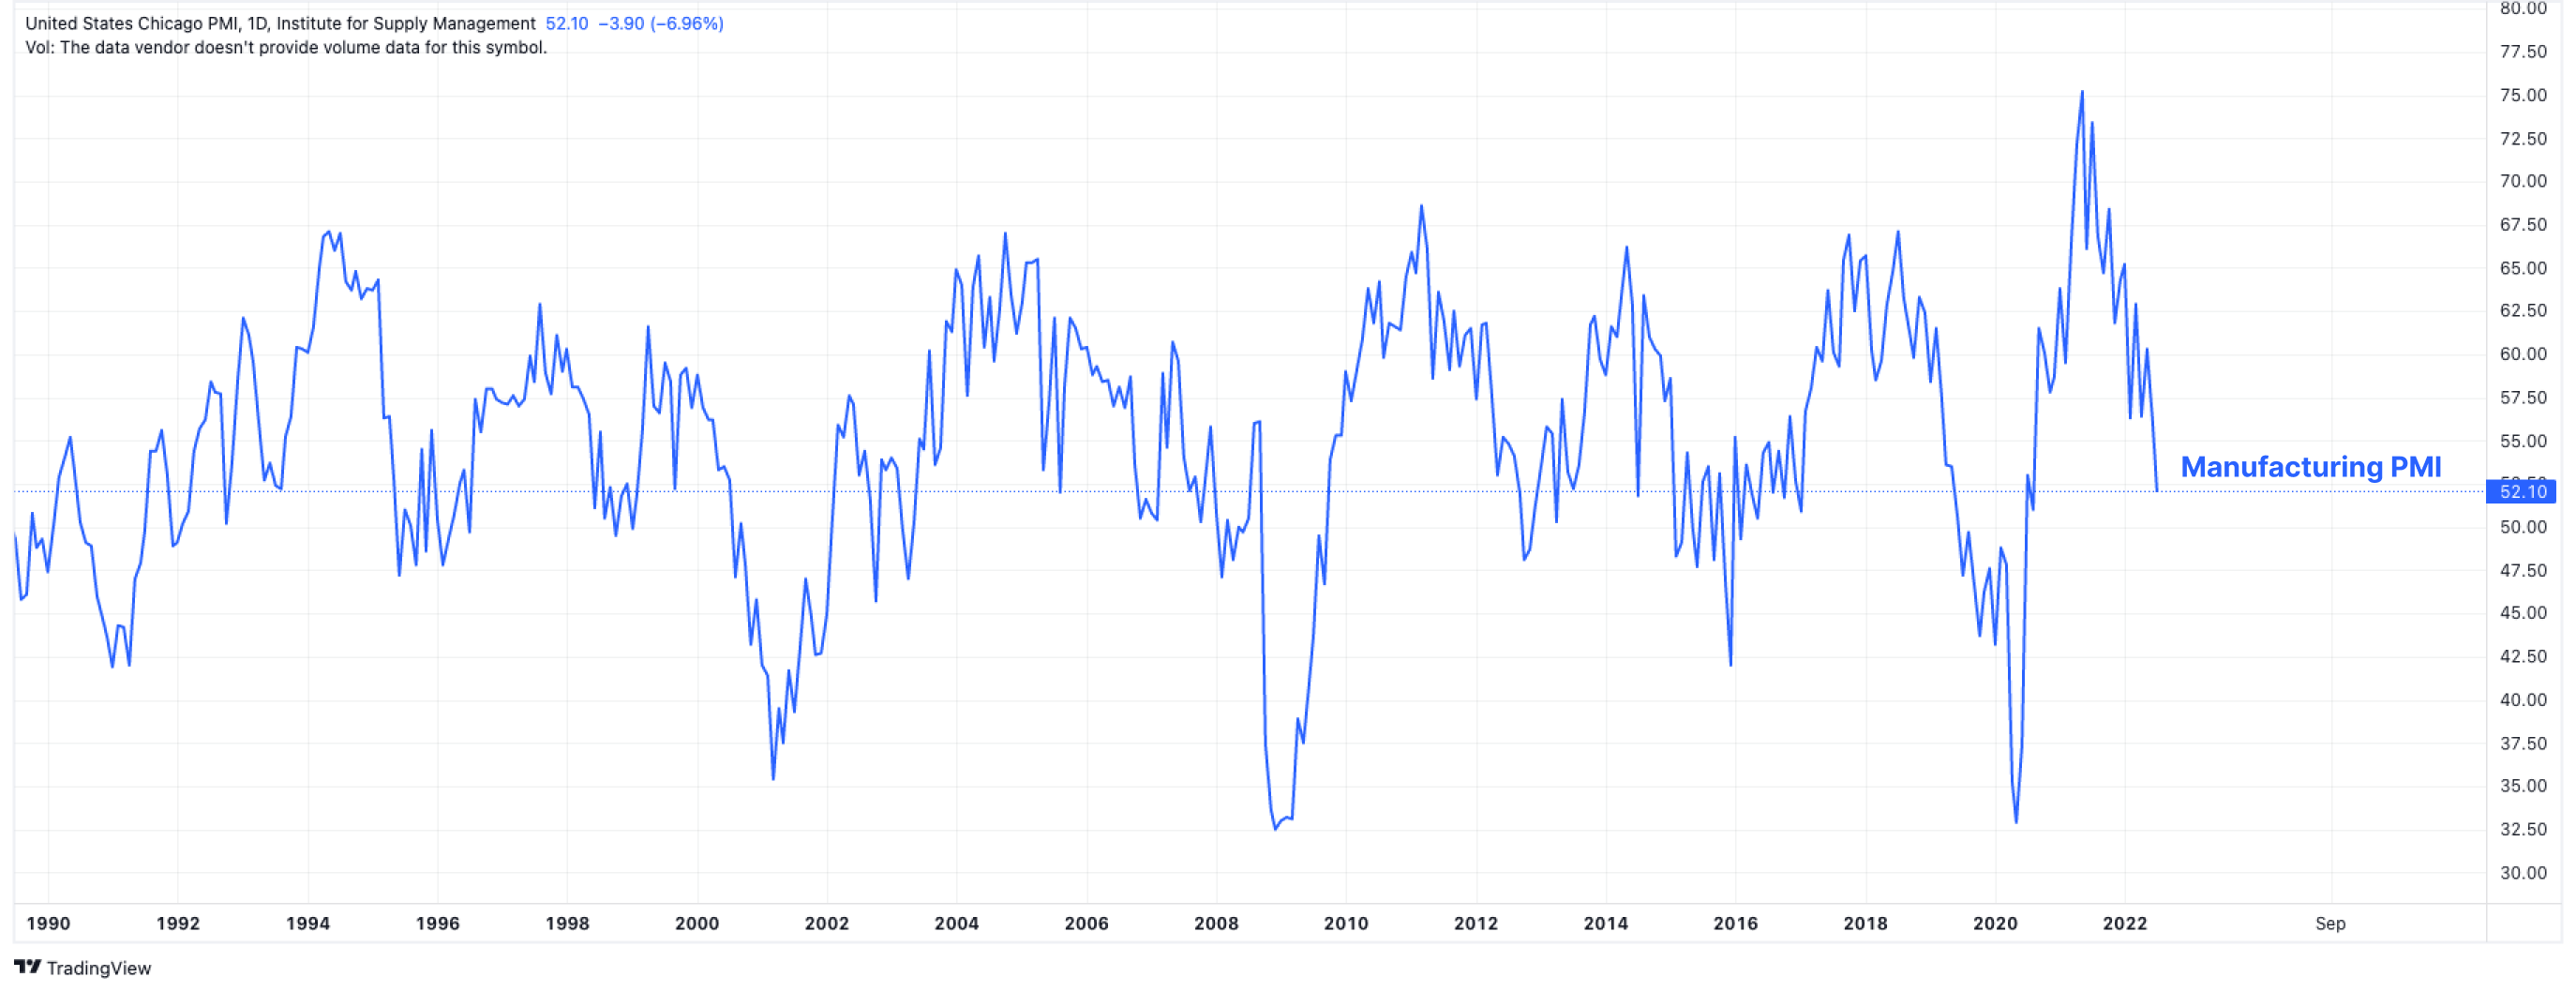
Uncertainty over the September FOMC outcome increased as the Manufacturing PMI dropped to 2020-levels (Figure 3), hinting at an increasingly dampened demand. According to the contractionary and decreasing services new orders index, service businesses cut back on new orders because of a downward trend in consumption.
Figure 3: Service providers cutback due to a slowing demand
The slightly better-than-expected core durable goods orders (0.3% MoM vs. 0.2% MoM expected, Figure 4) suggested that demand peaked as it reflected no change from June. The print marked the lowest year-on-year change (9.34%) since February. Consumers tend to postpone replacing items with longer useful life and bigger ticket during economic downturns, and this indicator seems to point in that direction despite the continued high employment.
Figure 4: Demand for core goods peaked

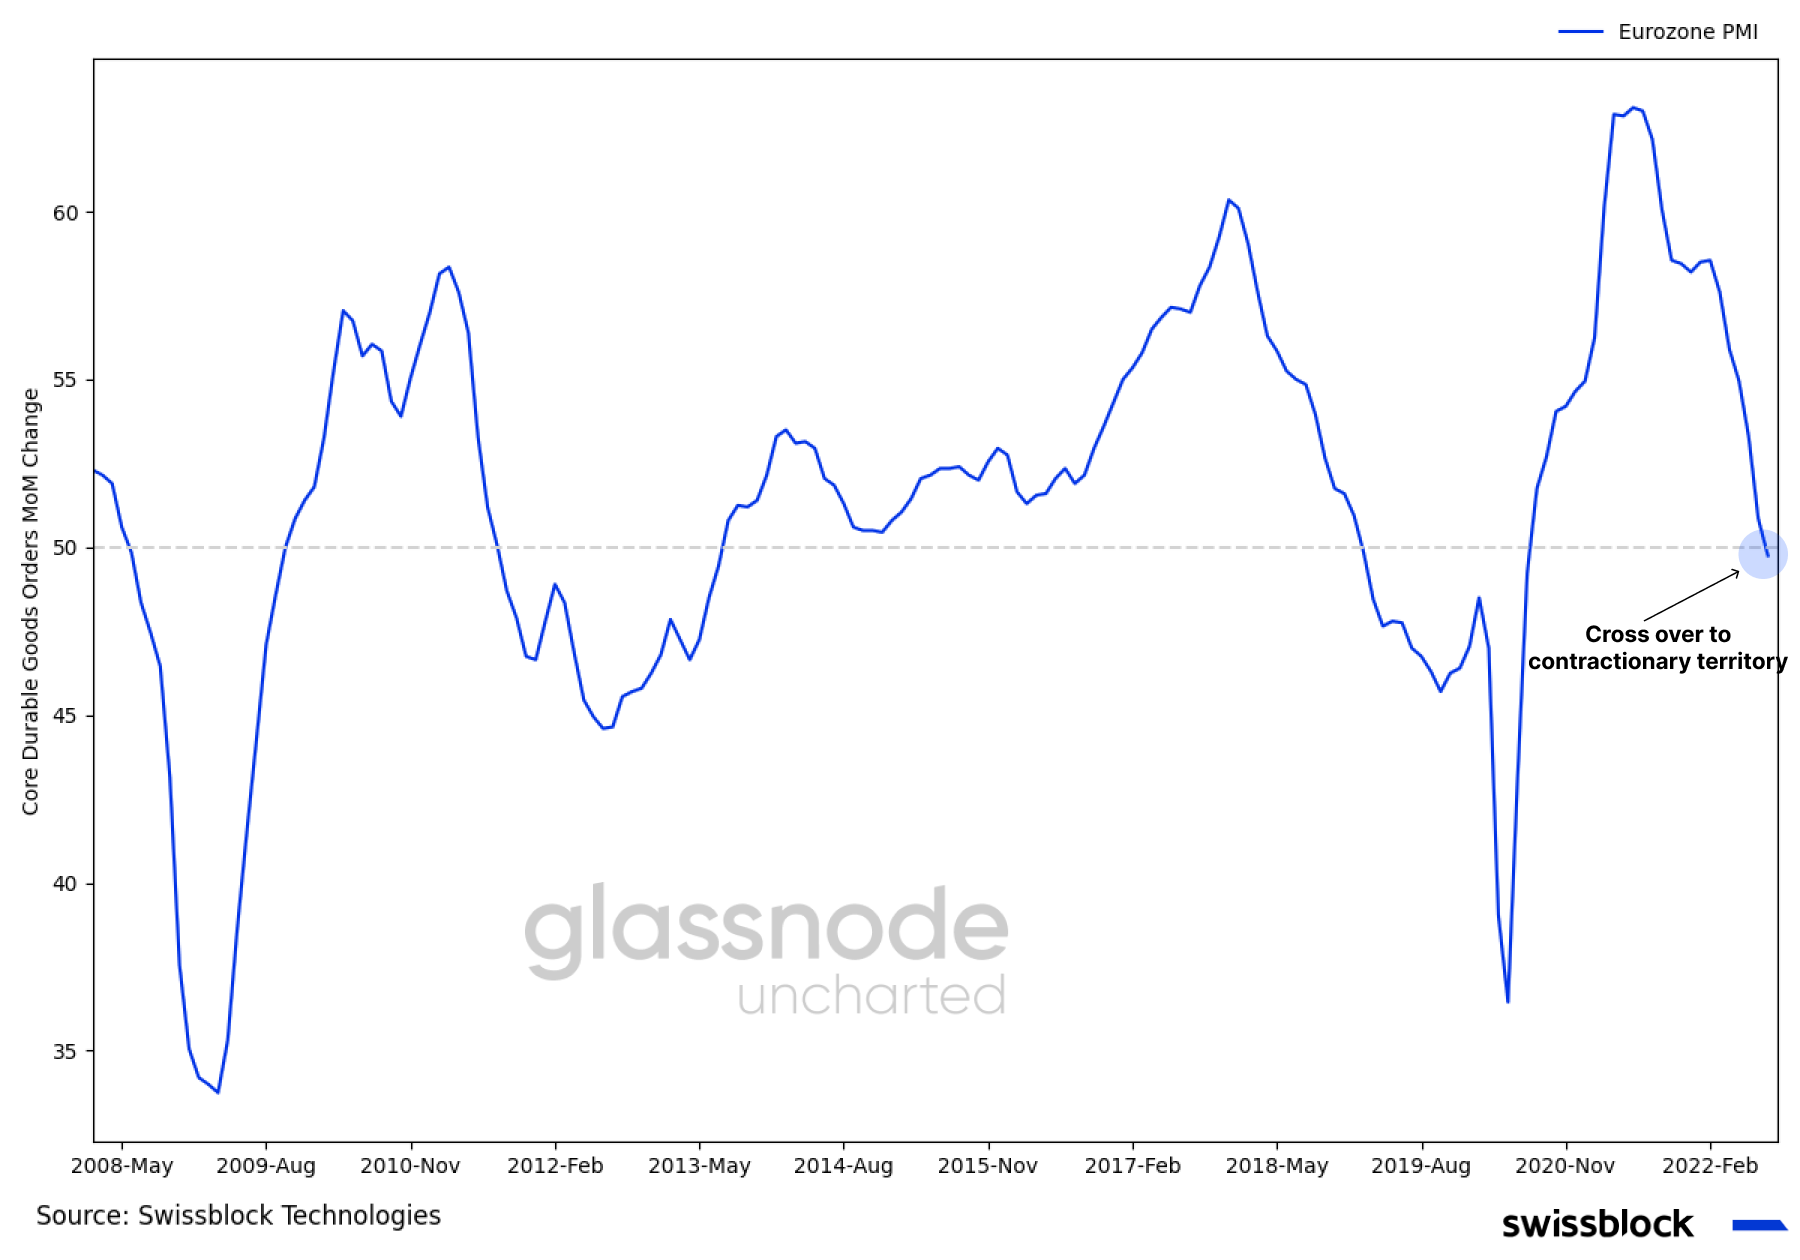
Europe is painting a troubling picture as well. July’s Eurozone Manufacturing PMI print remained in the contractionary territory (Figure 5). This decrease in business activity was mainly due to inflationary pressures as supply chains were constrained further. Higher energy prices and an uncertain gas supply have also led to grave concerns for businesses and the general population as winter approaches and the demand for gas is set to increase.
Figure 5: A gloomy winter is approaching the Eurozone
Supply chain constraints will likely endure as input prices increase at the expense of revived oil (Figure 6). Recent remarks on OPEC+ cutting supply to stabilize a disconnected physical and paper market drove the brent over $100. Based on the previous CPI report, we believe that the inflation rate will accelerate if energy prices continue to rise. Meanwhile, Saudi Aramco, Saudi Arabia’s oil company, and Exxon Mobil logged a record second quarter, reporting higher year-over-year profit (+90%) and year-over-year earnings (+280%), respectively.
Figure 6: Slowing inflation at risk of revived oil

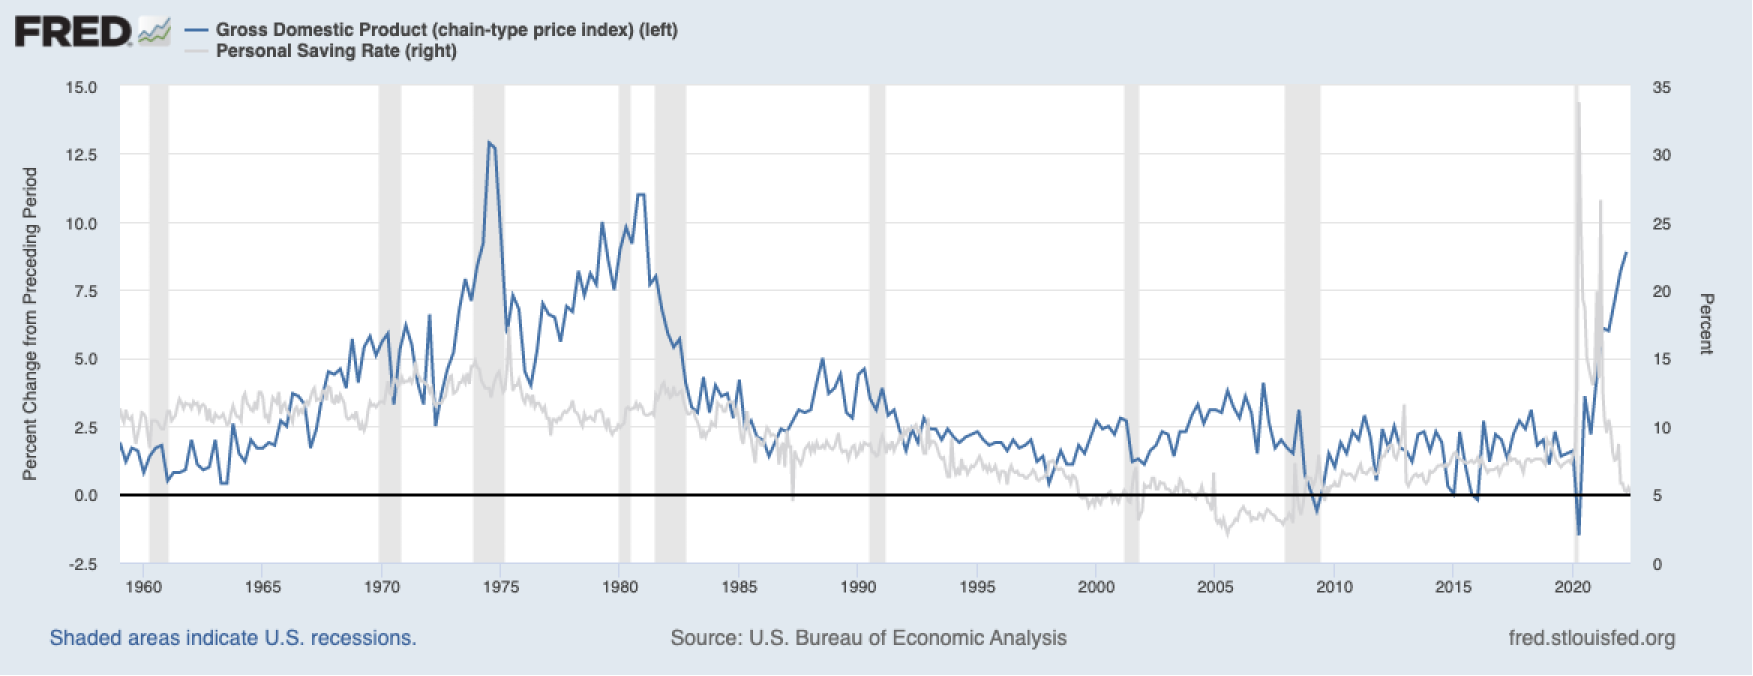
The economy faces supply-driven inflation, which lies outside the Fed’s reach. There is little more to do than to slow down demand before the economy breaks. The quarter-on-quarter increase in the GDP Price Index (9.0%) and decreasing savings rate (Figure 7) imply that consumers cannot withstand higher interest rates and revived inflationary pressures, which will have a direct negative impact on corporate earnings. However, this negative impact has yet to materialize at a larger scale, given an overall successful earnings season (with notable exceptions, such as Target) and massive hiring across the board.
Figure 7: Unsustainable living standards
All these economic red flags, combined with continued high employment, cause concerns and uncertainty over the Fed’s course of action and selling pressure across markets.
Where is capital flowing in the high-risk environment?
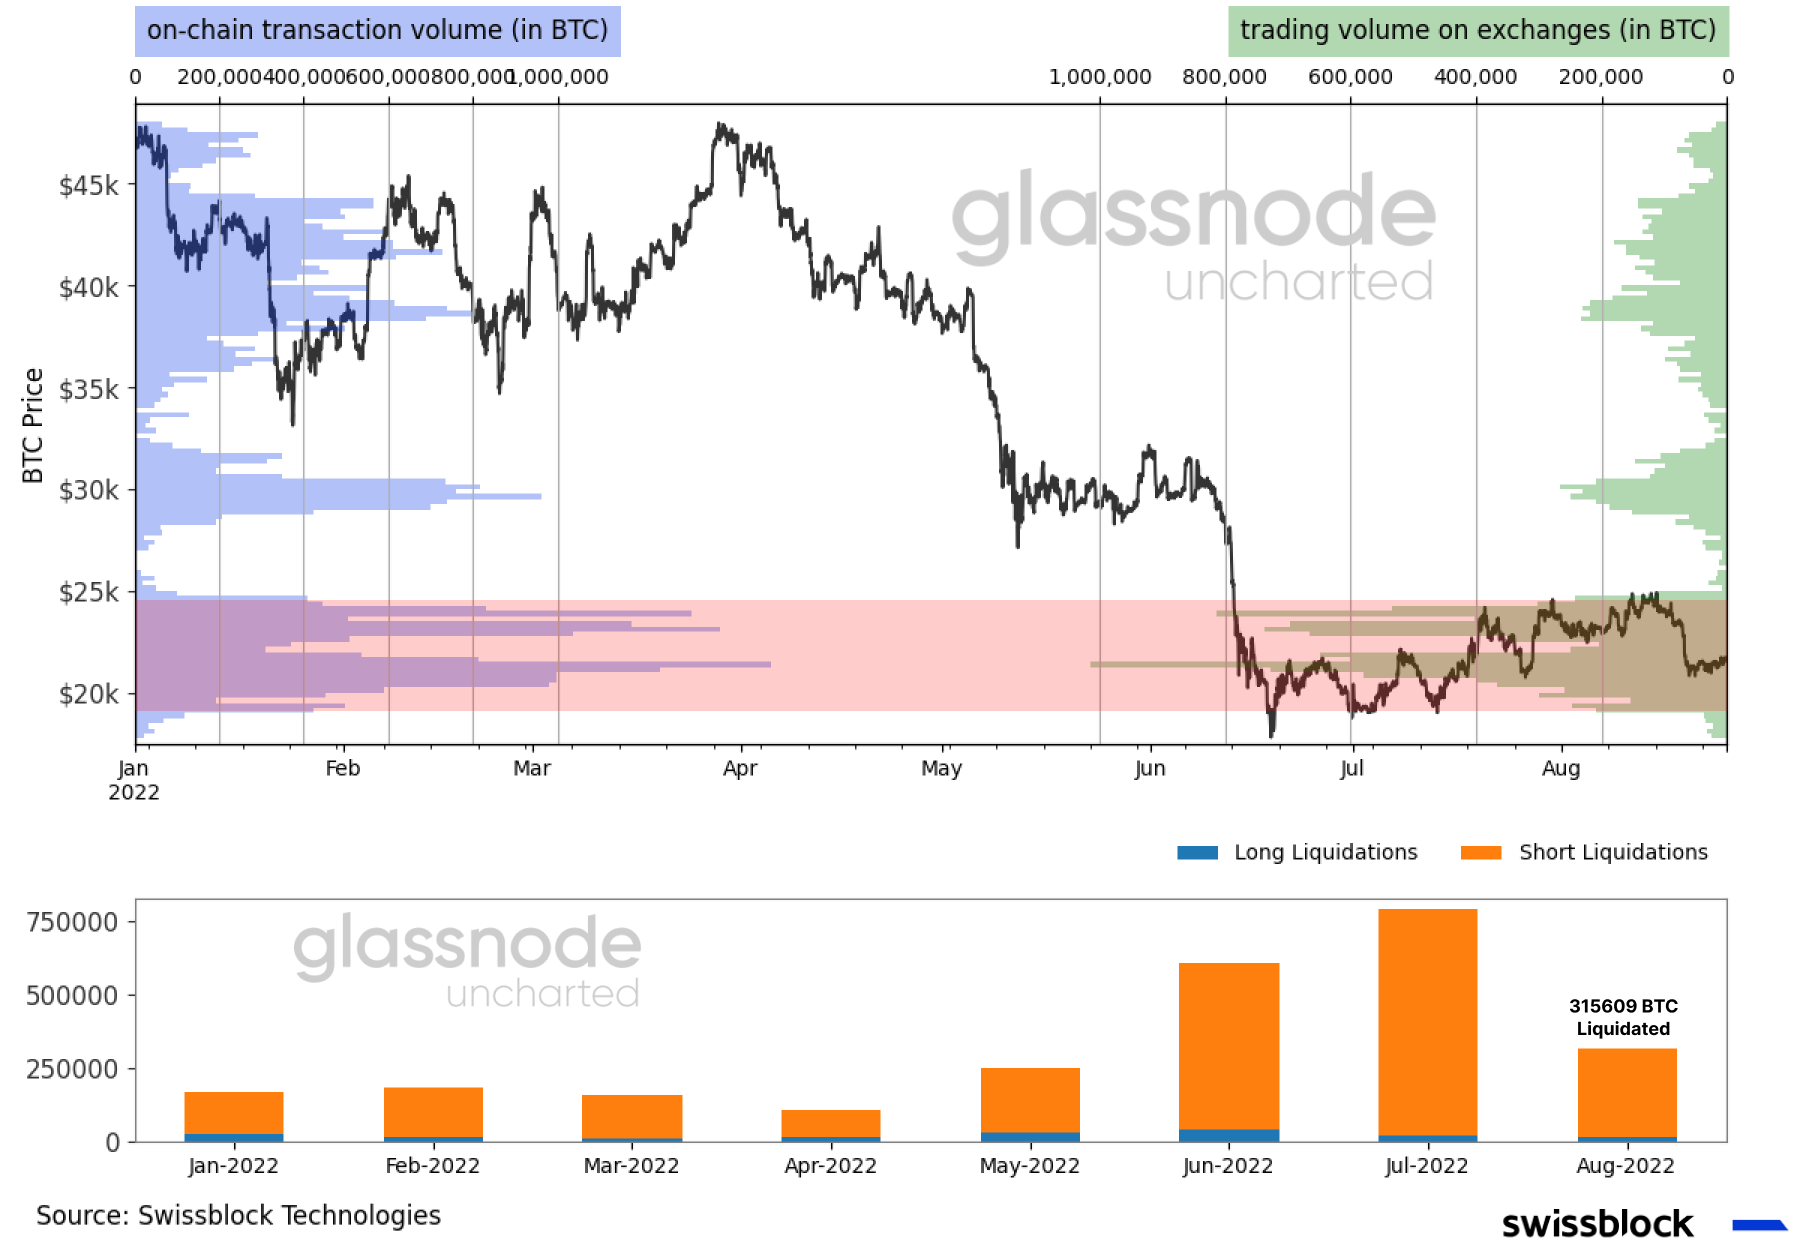
Crypto was not spared from this uncertainty. Over $500 million in positions got liquidated during the systematic retrace. Bitcoin comprised around $210 million of the total liquidations as the price got rejected at the $25k resistance level noted in Uncharted #21 (Figure 8).
Figure 8: $200+ million bitcoin liquidations drove the price towards the low $20k area
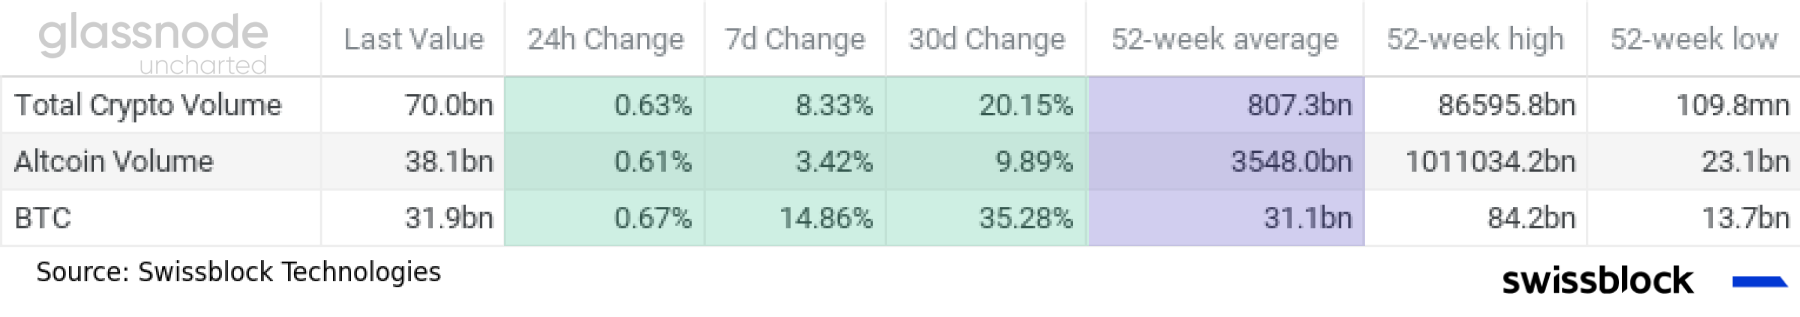
Post-liquidations, we noted restored resilience as liquidity in the spot market picked up. The uptick in volume equates to an increase in interest (Figure 9), yet considering the average traded volume, it appears that further firepower is required to resist external pressures.
Figure 9: Relatively low interest in the spot market
Overall sentiment in the crypto market remained relatively stable, considering the downward trend in the number of perpetual swaps with negative funding rates (Figure 10). However, the metric stands at high levels characterized by risk. Notice how the Bitcoin Risk Signal progressed to the high-risk zone as funding rates turned negative.
Figure 10: Swissblock's Bitcoin Risk Signal back at the high-risk zone

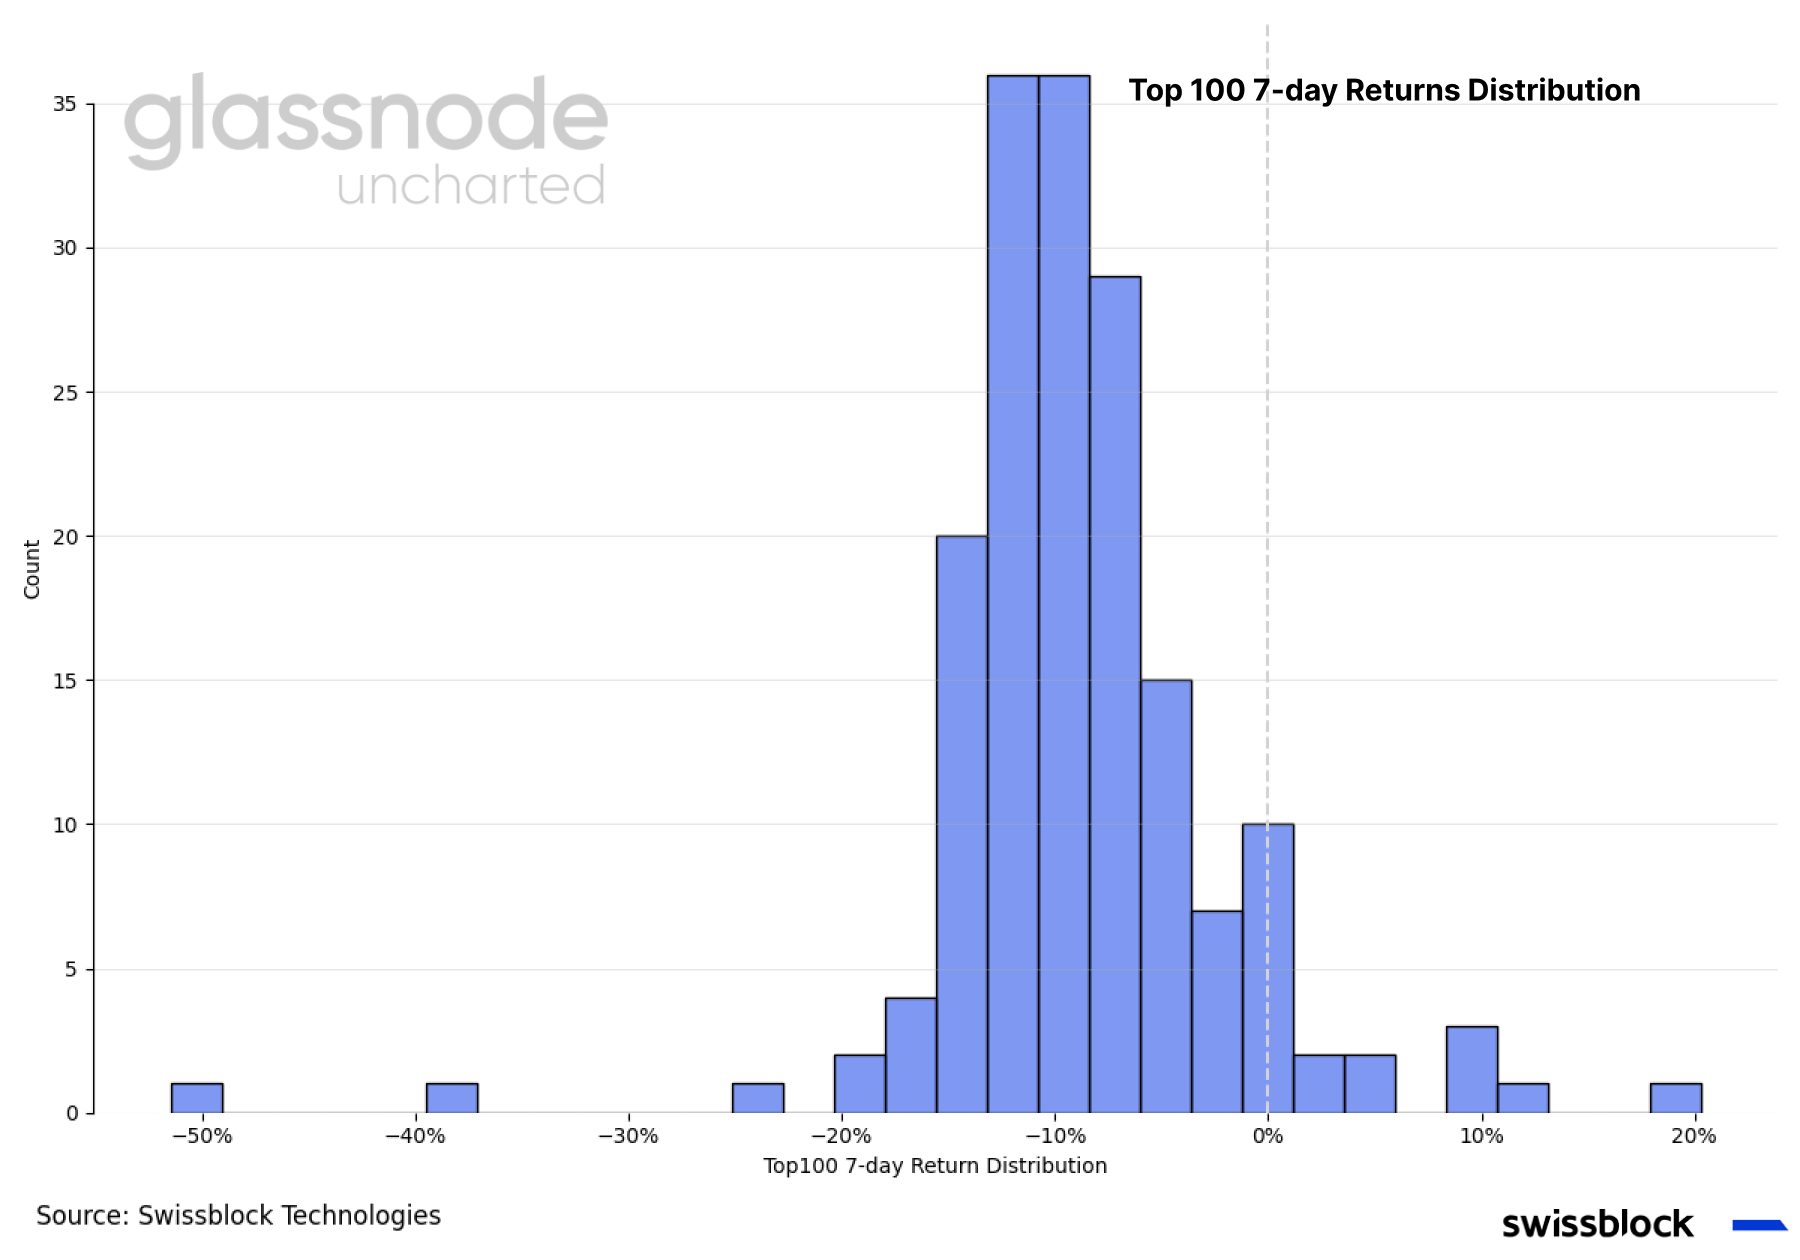
When looking at the distribution of the 7-day returns of the top 100 cryptos based on market capitalization, we can see the selling pressure spread (Figure 11). Nearly 91% of the top 100 cryptos trade in the negative, hinting at an overall altcoin underperformance.
Figure 11: 91% of the top 100 cryptos in the negative
Swissblock’s indices and Altcoin Cycle Signal reflect that altcoins overall lost steam. Notice how bitcoin and the top 10 index year-to-date returns diverged from the altcoin index (Figure 12). At the same time, the Altcoin Cycle Signal dropped.
Keep reading with a 7-day free trial
Subscribe to Swissblock Insights to keep reading this post and get 7 days of free access to the full post archives.