


Uncharted 18

Dear subscribers,
With bitcoin’s price hovering around the $20k momentous level, pressured by idiosyncratic and systematic risks, the most sought-after analysis is focused on the price structure. Before indulging in the significant price levels, we must understand the current environment.
We have covered the monetary policy and geopolitical environment leading to the current rout more in-depth in previous Uncharteds, and in this edition, we will take the opportunity to go much deeper into the market forces pulling bitcoin’s price to certain significant levels. Our approach in this Uncharted 18 will be different, data-heavy, and certainly challenging to the reader. Your feedback is more welcome than ever.
Let’s dig in!
TL;DR
Bitcoin is heavily oversold and trading along with the 200-week moving average, a significant recovery level.
The $17k - $20k support level is characterized by heavy volume and mainstream attention.
The net unrealized profit and loss ratio suggests that the investors capitulated as the rate of realized losses decreased.
Swissblock’s Bitcoin Risk Signal extended at the extreme of the high-risk regime as incoming macroeconomic data has put investors on edge.
Increasing leverage in the system made way for an impending aggressive move in the near future, where the next side of liquidations may well happen on the short side.
Will bitcoin break below $17k - $20k, triggering massive liquidations, and bottom around $9k - $13k? Or will it charge to the $29k - $32k resistance level?
Bitcoin’s price structure
It is the first time the price trades for consecutive days (7-days) beneath the 200-week moving average ($22k). In bitcoin’s history, the slow-moving average has served as a recovery level, closing once below but crossing over the following week. Extreme selling pressure - denoted by the most oversold RSI in history and a trailing MACD (Figure1) - hinted that the bottom is potentially in following Saturday’s $17,708 low.
Figure 1: Bitcoin at a momentous support level
Looking into the bounces off the 200-week moving average, it becomes evident that Swissblock’s Bitcoin Risk Signal has extended to the high-risk extreme (100) (Figure 1, blue circles). The unrealized and realized loss delta plunged but quickly reverted as investors stopped materializing losses, giving bitcoin room to recoup (Figure 2, red areas).
Figure 2: Easing realized losses
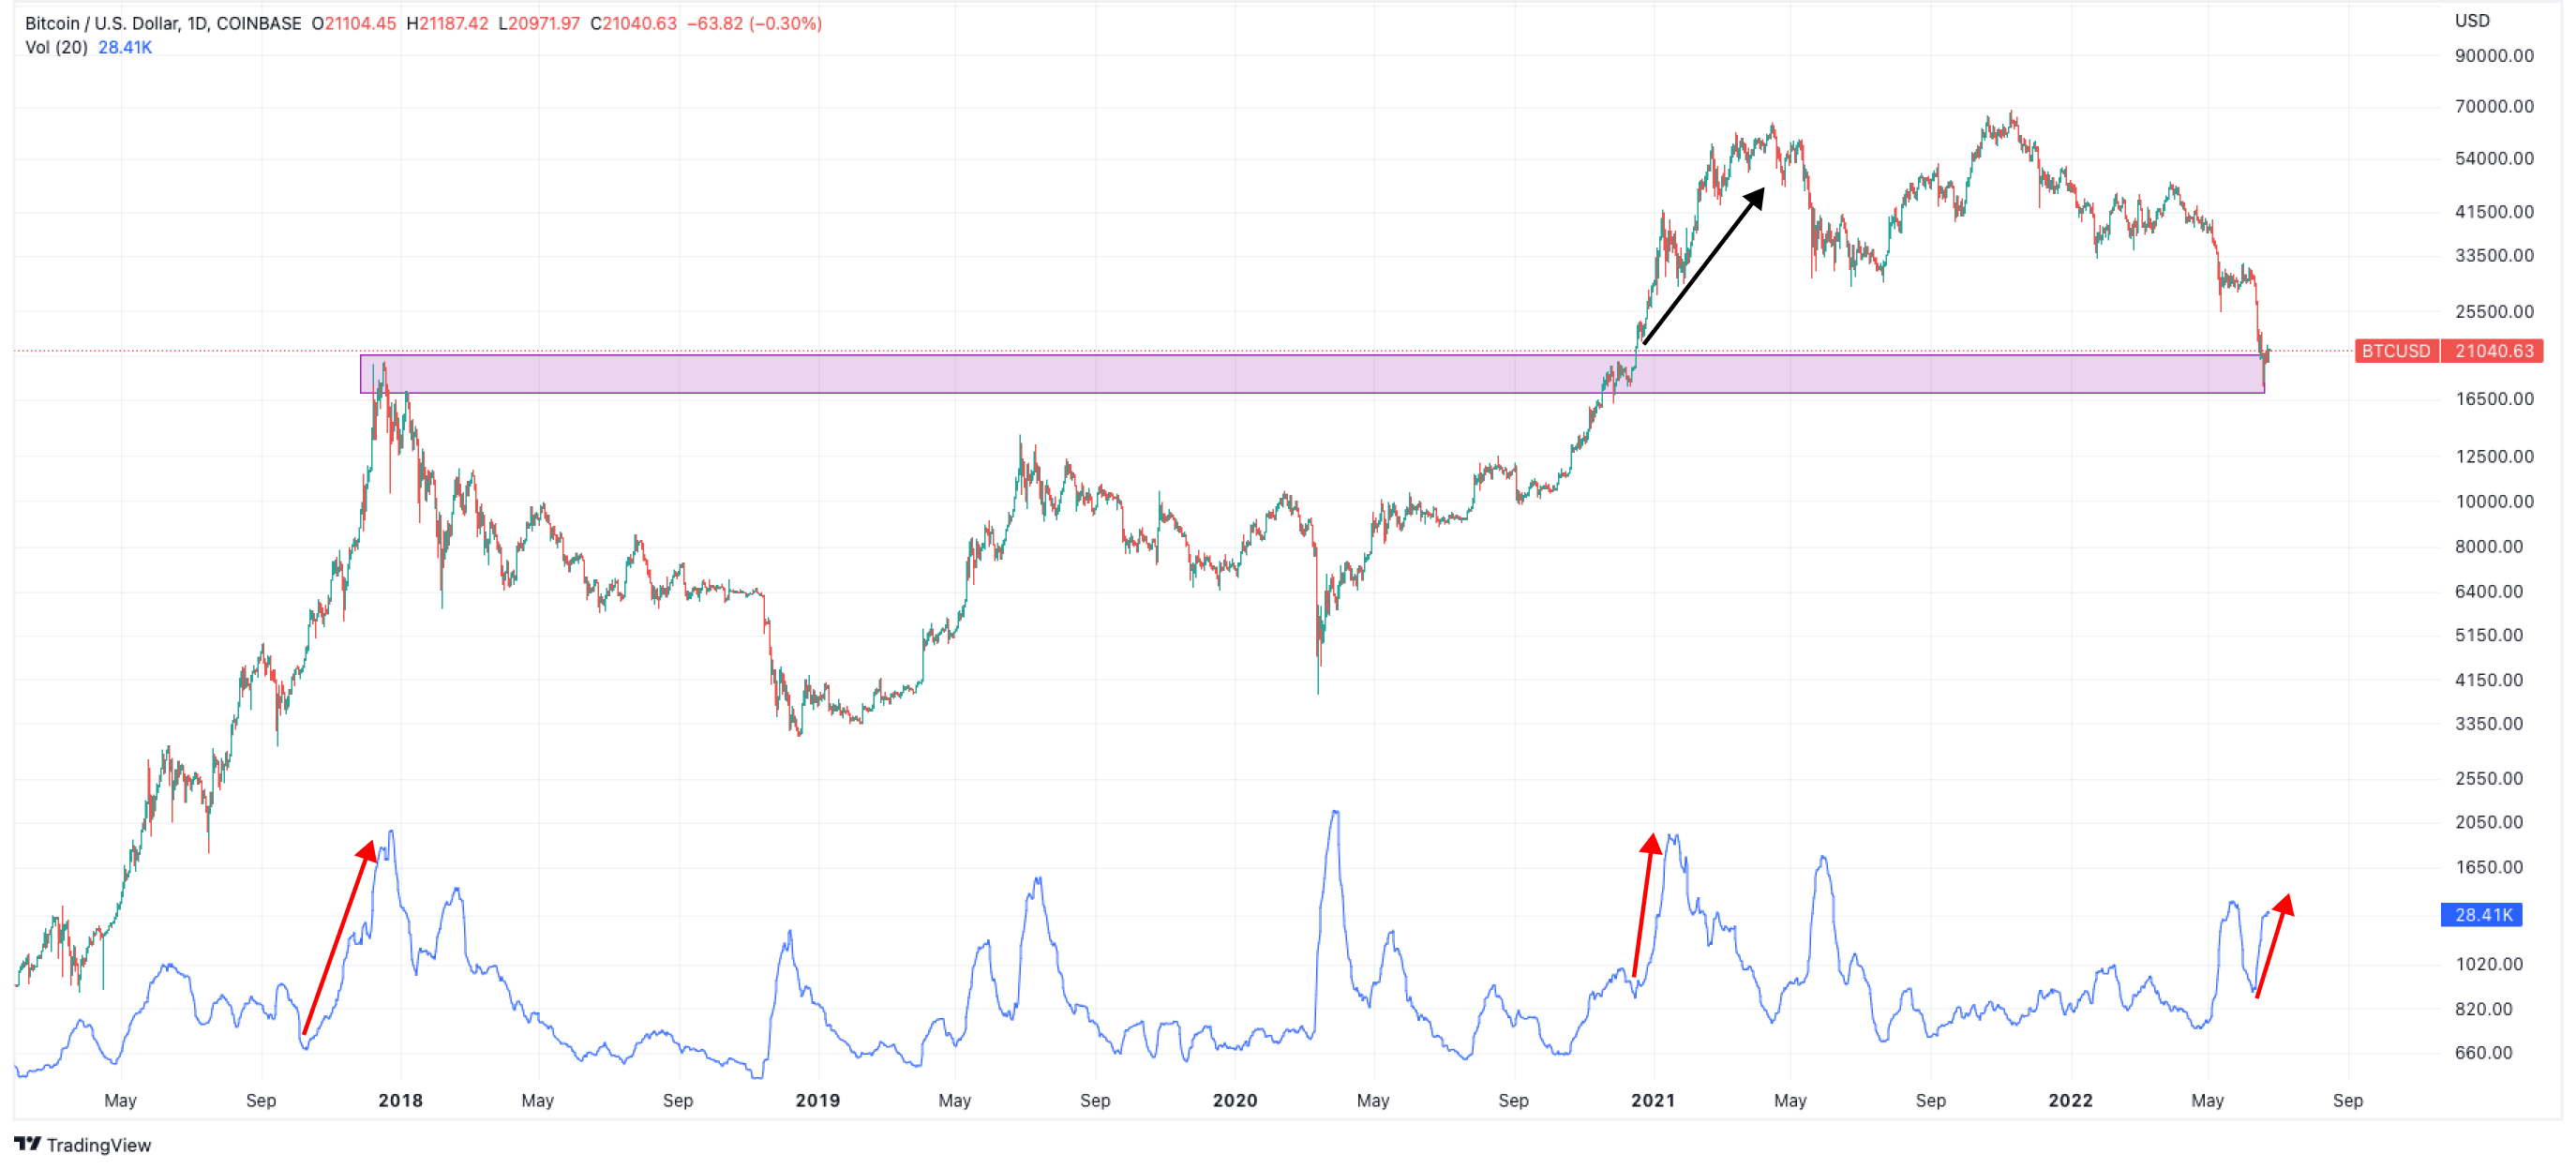
When zooming into the $17k - $20k support level, it appears that the current range is a heavily traded volume area (Figure 3, red arrows). Before 2020 the said trading channel was considered the most liquid top as bears managed to push the price down. However, following the run to $60k, the colossal resistance turned into a strong support level.
Figure 3: $17k - $20k support: a heavily traded range
In 2020, bitcoin grasped the attention of sophisticated and retail investors as the google search term spiked and accelerated to its highest level (Figure 4). Once again, bitcoin holds at the $17k - $20k support level, and the google term ‘bitcoin’ is trending.
Figure 4: Bitcoin caught the attention of the internet
The question remains whether bitcoin will thrust toward the next resistance level around $27k and $32k or whether the schizophrenic macroeconomic environment and consequent risk of liquidations will convert the $17k - $20k into resistance once again.
Figure 5: Bitcoin’s significant price levels
Bitcoin’s support levels in the context of market structures
Bitcoin’s downtrend to our current trading channel initiated as investors began to speculate over a higher-than-expected CPI and the Fed’s consequent reaction. The said external factors triggered massive liquidations as key players in the crypto space faced imminent insolvency.
Keep reading with a 7-day free trial
Subscribe to Swissblock Insights to keep reading this post and get 7 days of free access to the full post archives.