


Uncharted #13: Bites

Dear subscribers,
In this edition of Uncharted: Bites, we compiled the major points from Uncharted #13. We start by analyzing bitcoin’s drop below $38k and its potential catalysts. Focusing on the traditional markets’ structures and evaluating their effect on bitcoin’s price action, focusing on the fear reflected in the derivatives market. Swissblock's proprietary signals suggest an altcoin-driven market with increased risk and robust fundamentals.
Let’s dig in!
TL;DR
Bitcoin is forging a new support level around $39-$40k.
Bitcoin’s retrace below $40k was led by a stronger correlation to traditional markets.
Off-chain volume suggests exogenous factors are driving the price action.
The accumulation phase continues (221-days and counting) with accumulation balances increasing above $118 billion.
Fear spread in the derivatives market as cash-margin open interest increased alongside the demand for downside hedging.
Swissblock’s Altcoin Cycle Signal indicates a migration to altcoins driven by revived altcoin returns.
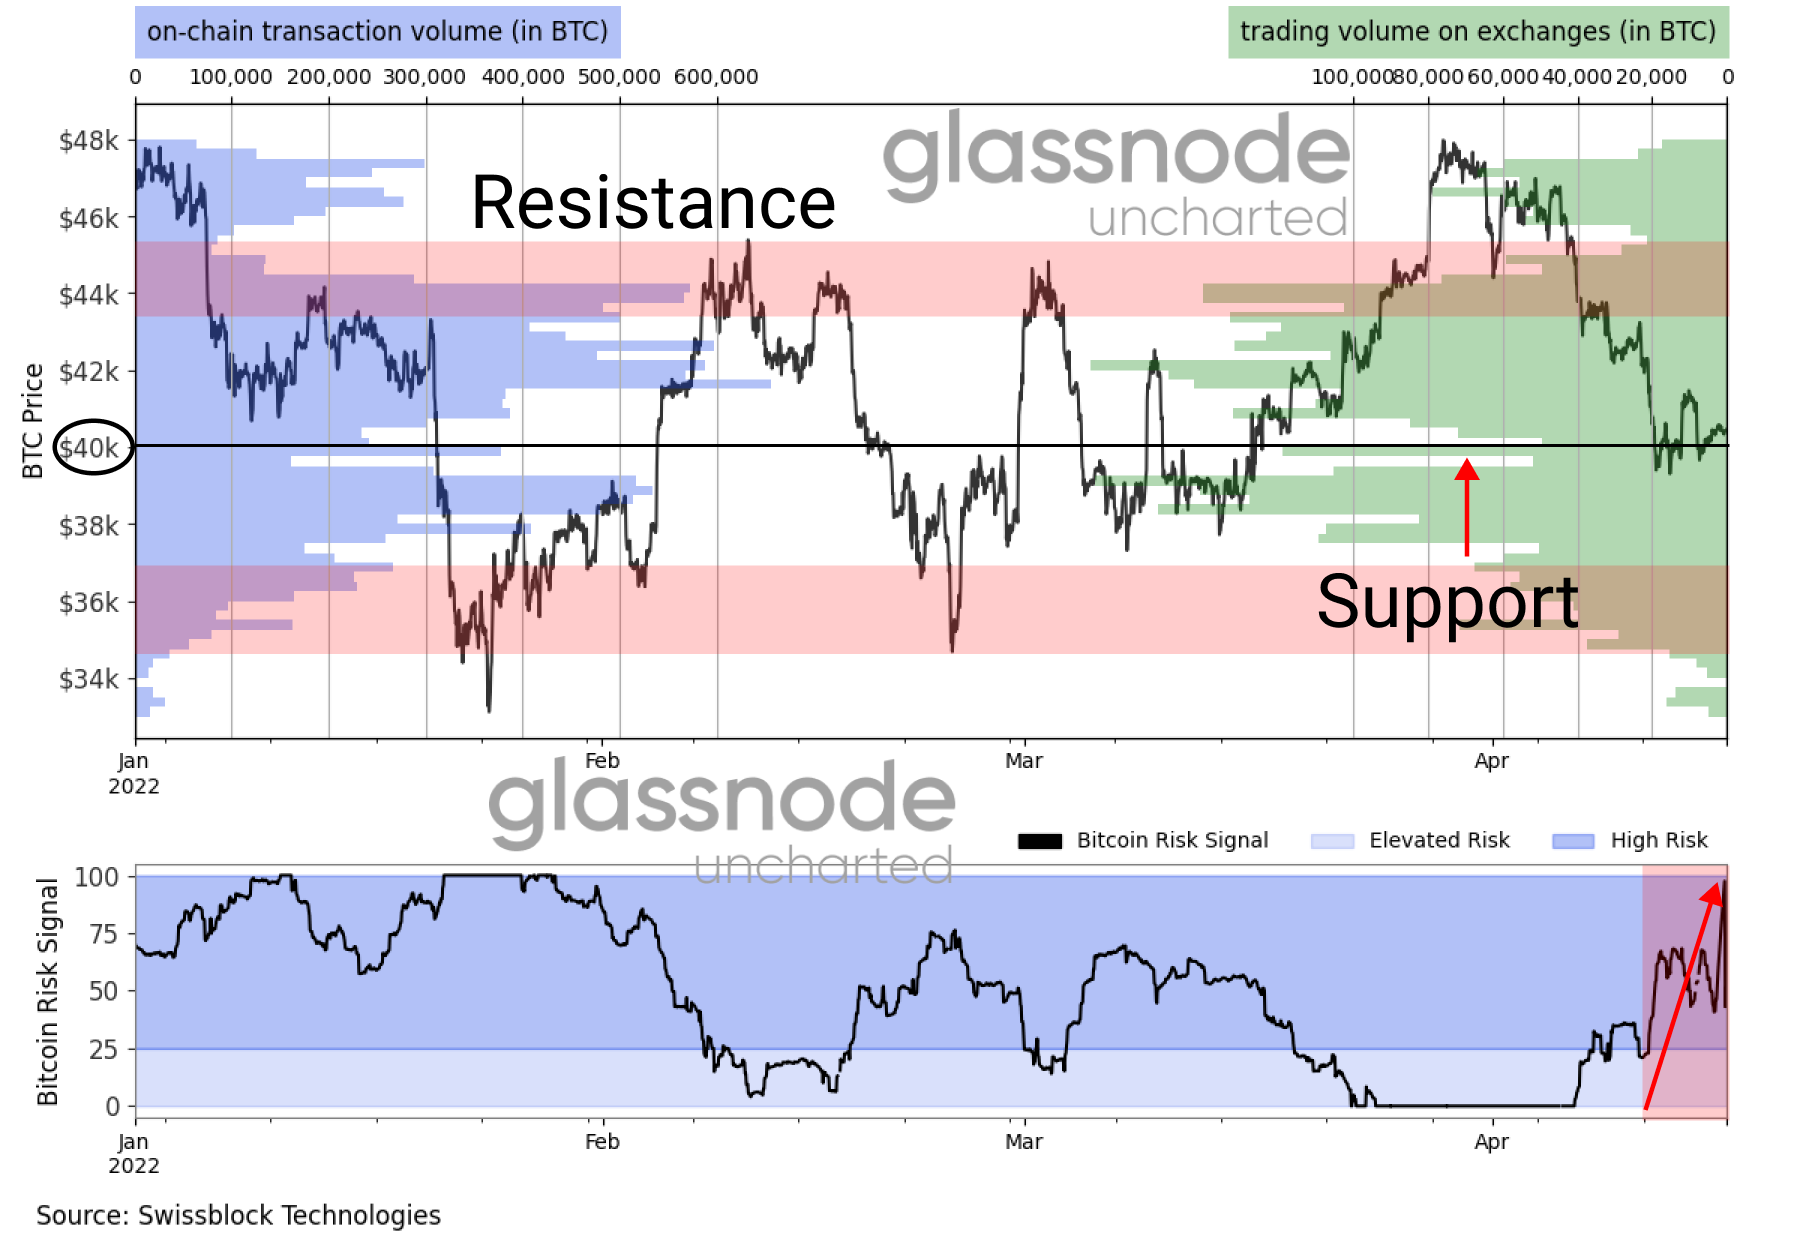
Swissblock’s Bitcoin Risk Signal crossed over to the high-risk zone. Caution is advised.
Bitcoin in the eye of the storm
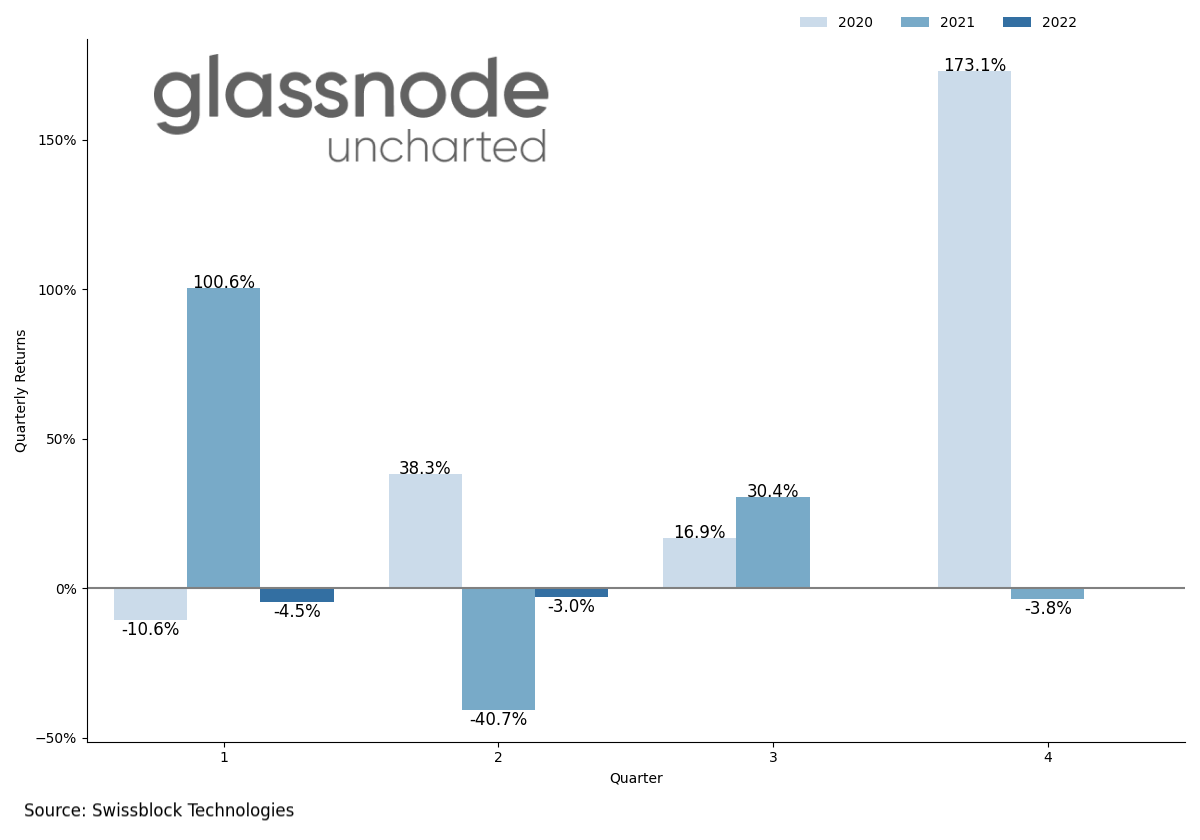
Despite the ongoing war in Ukraine, high inflation expectations, and higher volatility, bitcoin erased most of its losses in Q1 2022. The price gained traction towards the end of March, pushing the quarterly close to -4.53% (Figure 1), while the SP 500 logged its first losing quarter in 2 years (-4.6%).
Figure 1: Bitcoin’s quarterly returns
The recent retrace from $47k to $40k followed hawkish comments from the Fed, to fight rising inflation, encouraging sell-offs across US equities and bonds. While this has reduced upward price momentum, bitcoin is forging a new support level around $39-$40k (Figure 2).
Figure 2: Support level forming around $39-$40k
While the Fed initiated offloading its balance sheet ($95 billion), investors followed suit and pulled nearly $5 billion in assets from US fixed-income securities and $14 billion from equities. However, recalling Uncharted #12 and year-to-date fund flows, investors are unconvinced about migrating to euro-denominated assets converting more capital to USD (Figure 3).
Figure 3: Capital flowing into the US dollar

As the DXY (Figure 3) approaches a significant resistance level, bitcoin saw the second-highest weekly outflows ($134 million in outflows). The capital outflows are ever more apparent when comparing bitcoin’s recent price action to its 100-day moving average. Resurgent selling continued to push the price to the capital outflows quadrant (Figure 4).
Figure 4: Capital flowing out of bitcoin and US equities

For an in-depth analysis of Figure 4, read Uncharted #13.
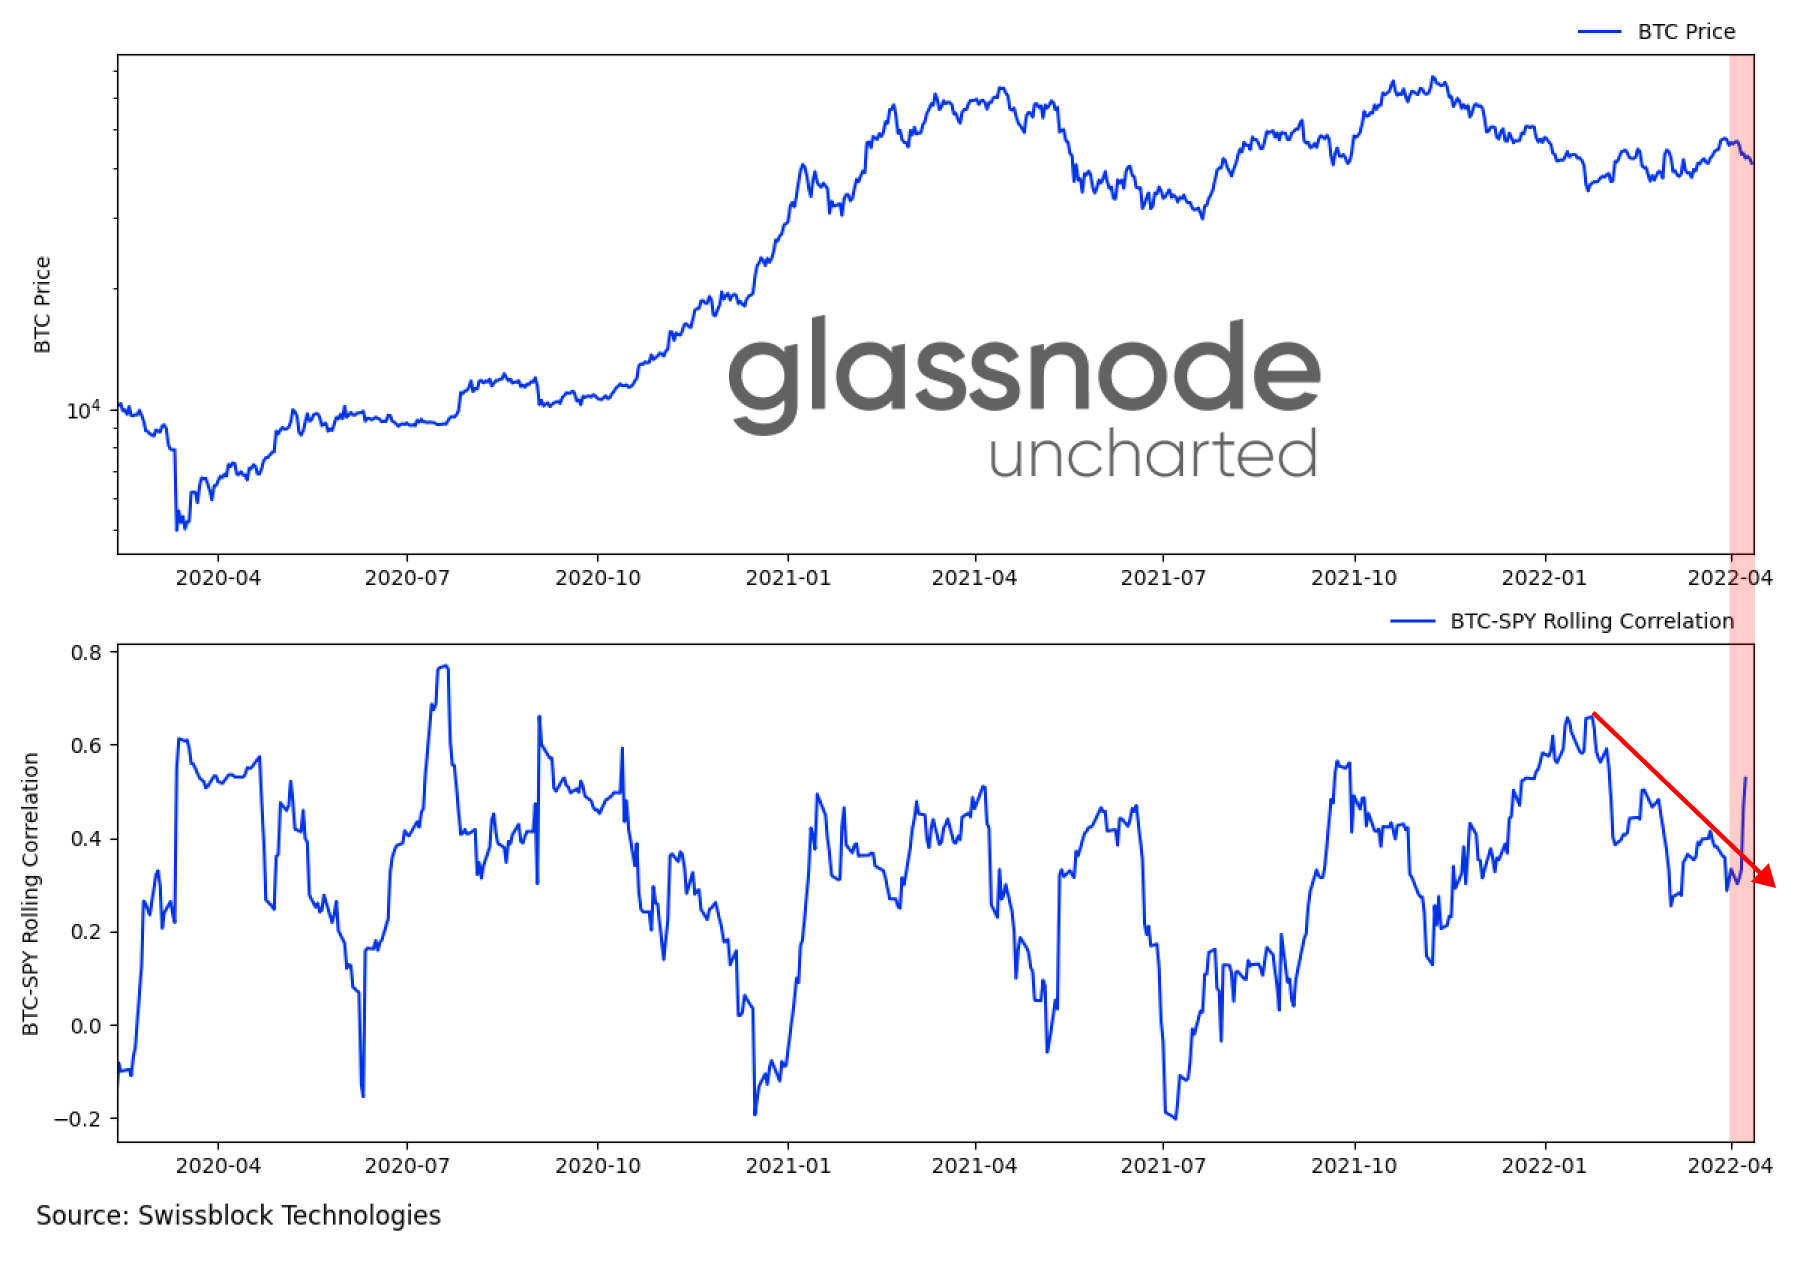
It becomes clear that bitcoin’s drop below $40k was a ripple effect initiated in traditional markets. Notice how bitcoin reverted to $38k once the correlation to the S&P500 broke out of its downward trend (Figure 5).
Figure 5: Stronger ties to US equities
The path forward
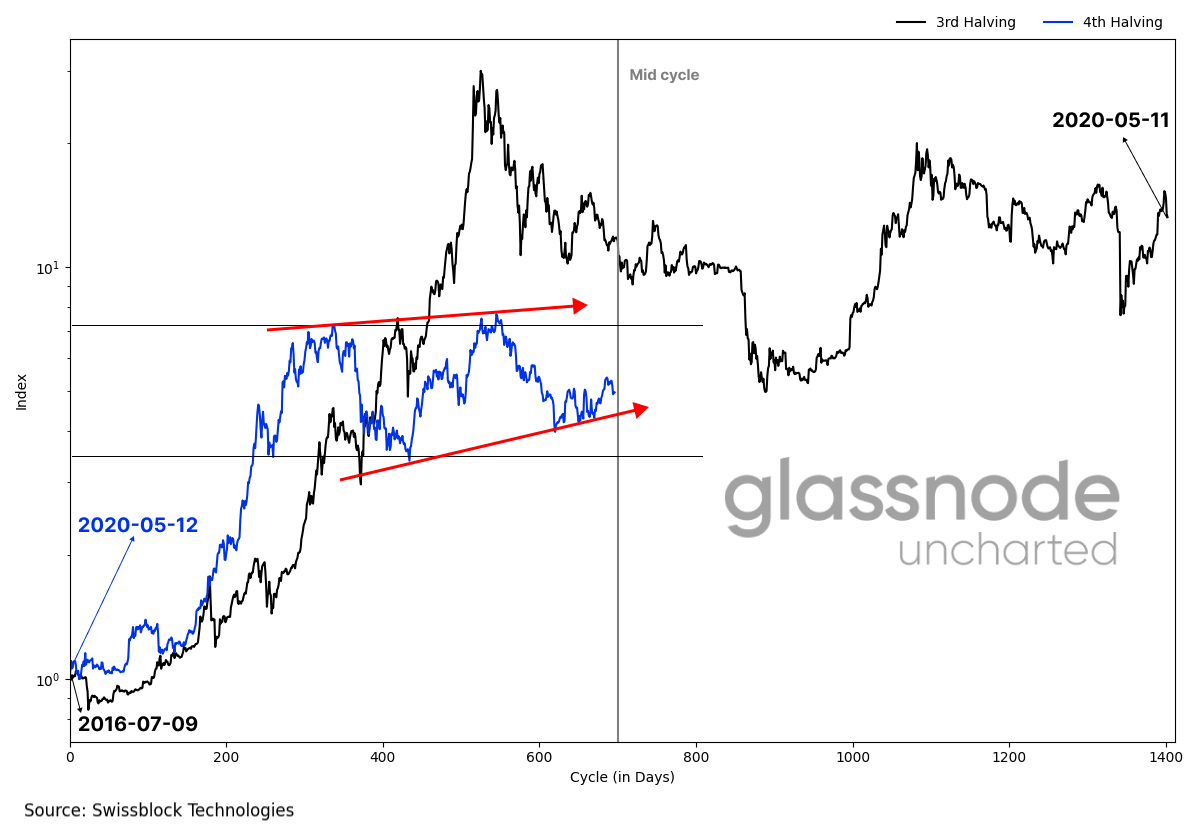
When looking at bitcoin from a cycle perspective, we can see that we have been in a vertical accumulation phase since Q4 2020 (Figure 6). Smart money has been buying from inexperienced traders. The total balance in accumulation addresses reached 2.9 million BTC or $118 billion last week.
Figure 6: An accumulation phase
Furthermore, from a fundamental perspective, Swissblock’s Network Growth and Liquidity indices show organic growth (Figure 7, red area) despite last week’s sluggish price action.
Keep reading with a 7-day free trial
Subscribe to Swissblock Insights to keep reading this post and get 7 days of free access to the full post archives.